MASS::fitdistr() is used to fit coefficients of a specified family of
distributions and the resulting density curve is displayed.
Usage
gf_fitdistr(
  object = NULL,
  gformula = NULL,
  data = NULL,
  ...,
  dist = "dnorm",
  start = NULL,
  alpha,
  color,
  fill,
  group,
  linetype,
  linewidth,
  size,
  xlab,
  ylab,
  title,
  subtitle,
  caption,
  geom = "path",
  stat = "fitdistr",
  position = "identity",
  show.legend = NA,
  show.help = NULL,
  inherit = FALSE,
  environment = parent.frame()
)
Arguments
- object
When chaining, this holds an object produced in the earlier portions of the chain. Most users can safely ignore this argument. See examples.
- gformula
A formula with shape
~ xused to specify the data to be fit to a family of distributions.- data
A data frame containing the variable to be fitted.
- ...
Additional arguments
- dist
A quoted name of a distribution function. See
mosaicCore::fit_distr_fun()for more details about allowable distributions.- start
Starting value(s) for the search for MLE. (See MASS::fitdistr.)
- alpha
Opacity (0 = invisible, 1 = opaque).
- color
A color or a formula used for mapping color.
- fill
A color for filling, or a formula used for mapping fill.
- group
Used for grouping.
- linetype
A linetype (numeric or "dashed", "dotted", etc.) or a formula used for mapping linetype.
- linewidth
A numerical line width or a formula used for mapping linewidth.
- size
size aesthetic for dots in pmf plots.
- xlab
Label for x-axis. See also
gf_labs().- ylab
Label for y-axis. See also
gf_labs().- title, subtitle, caption
Title, sub-title, and caption for the plot. See also
gf_labs().- geom
A character string naming the geom used to make the layer.
- stat
A character string naming the stat used to make the layer.
- position
Either a character string naming the position function used for the layer or a position object returned from a call to a position function.
- show.legend
A logical indicating whether this layer should be included in the legends.
NA, the default, includes layer in the legends if any of the attributes of the layer are mapped.- show.help
If
TRUE, display some minimal help.- inherit
A logical indicating whether default attributes are inherited.
- environment
An environment in which to look for variables not found in
data.
Specifying plot attributes
Positional attributes (a.k.a, aesthetics) are specified using the formula in gformula.
Setting and mapping of additional attributes can be done through the
use of additional arguments.
Attributes can be set can be set using arguments of the form attribute = value or
mapped using arguments of the form attribute = ~ expression.
In formulas of the form A | B, B will be used to form facets using
ggplot2::facet_wrap() or ggplot2::facet_grid().
This provides an alternative to
gf_facet_wrap() and
gf_facet_grid() that is terser and may feel more familiar to users
of lattice.
Evaluation
Evaluation of the ggplot2 code occurs in the environment of gformula.
This will typically do the right thing when formulas are created on the fly, but might not
be the right thing if formulas created in one environment are used to create plots
in another.
Examples
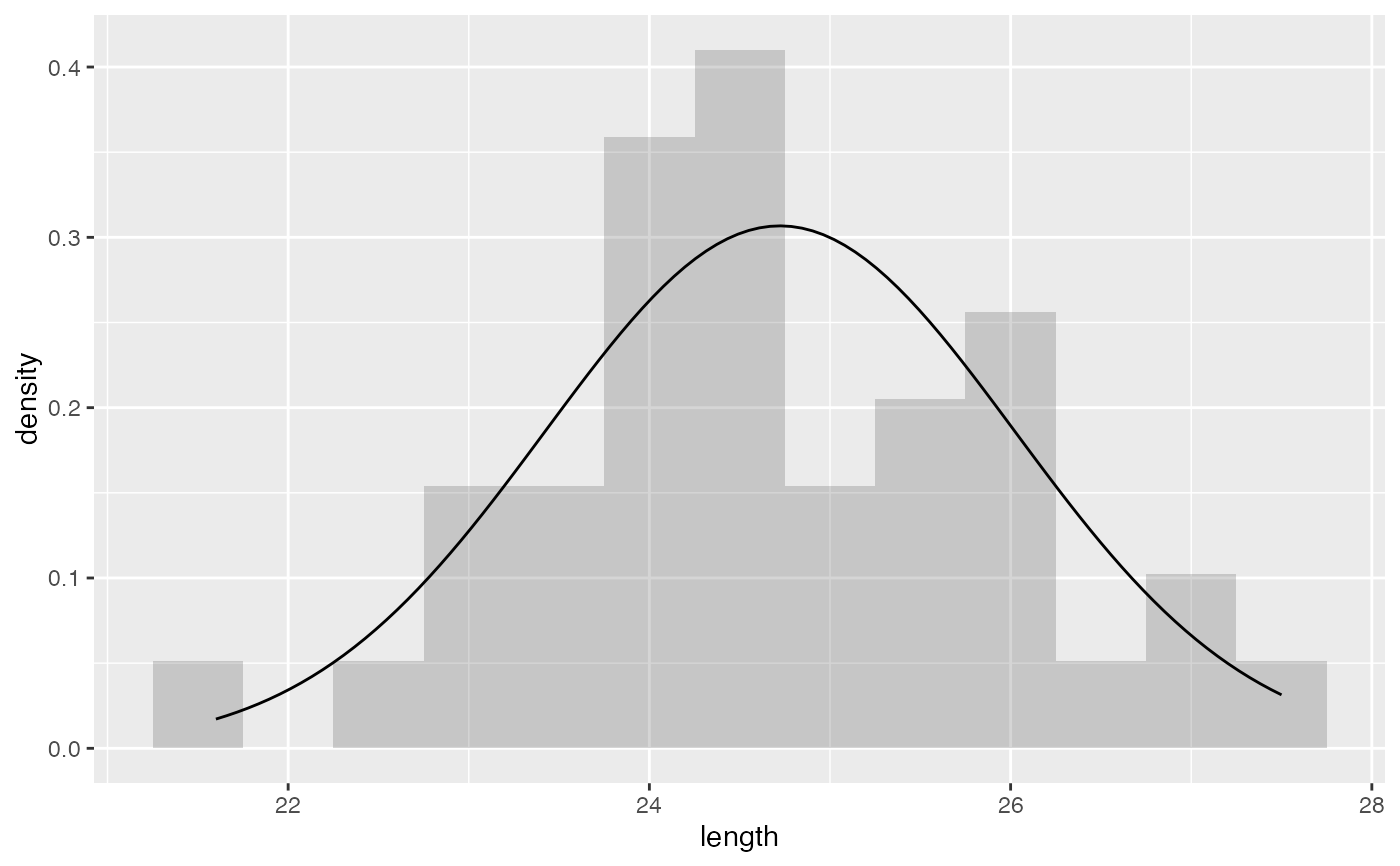
gf_fitdistr(~length, data = mosaicData::KidsFeet, inherit = FALSE) |>
gf_dhistogram(~length, data = mosaicData::KidsFeet, binwidth = 0.5, alpha = 0.25)
 gf_dhistogram(~length, data = mosaicData::KidsFeet, binwidth = 0.5, alpha = 0.25) |>
gf_fitdistr()
gf_dhistogram(~length, data = mosaicData::KidsFeet, binwidth = 0.5, alpha = 0.25) |>
gf_fitdistr()
 set.seed(12345)
Dat <- data.frame(
f = rf(500, df1 = 3, df2 = 47),
g = rgamma(500, 3, 10)
)
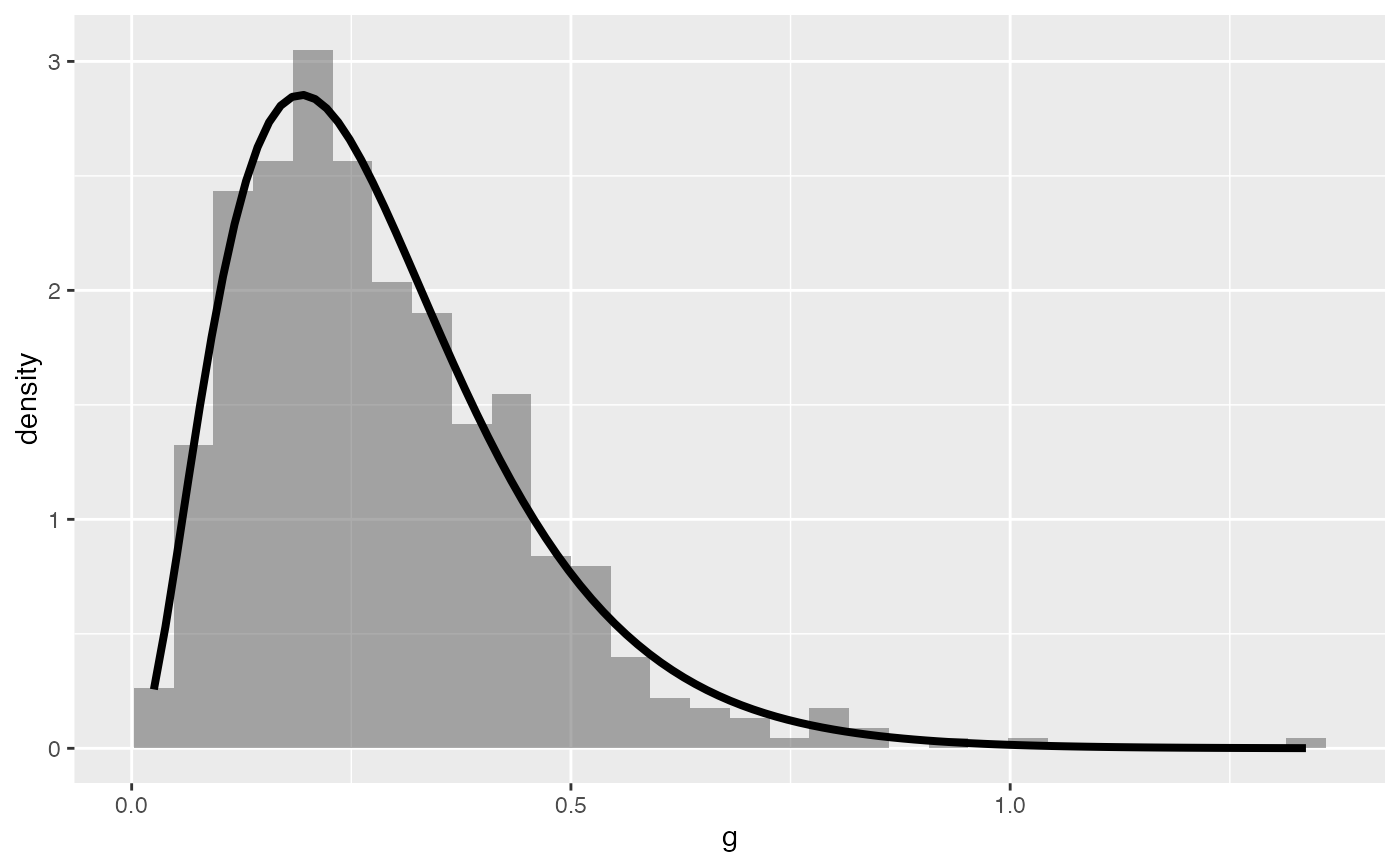
gf_dhistogram(~g, data = Dat) |>
gf_fitdistr(dist = "dgamma", linewidth = 1.4)
#> `stat_bin()` using `bins = 30`. Pick better value `binwidth`.
set.seed(12345)
Dat <- data.frame(
f = rf(500, df1 = 3, df2 = 47),
g = rgamma(500, 3, 10)
)
gf_dhistogram(~g, data = Dat) |>
gf_fitdistr(dist = "dgamma", linewidth = 1.4)
#> `stat_bin()` using `bins = 30`. Pick better value `binwidth`.
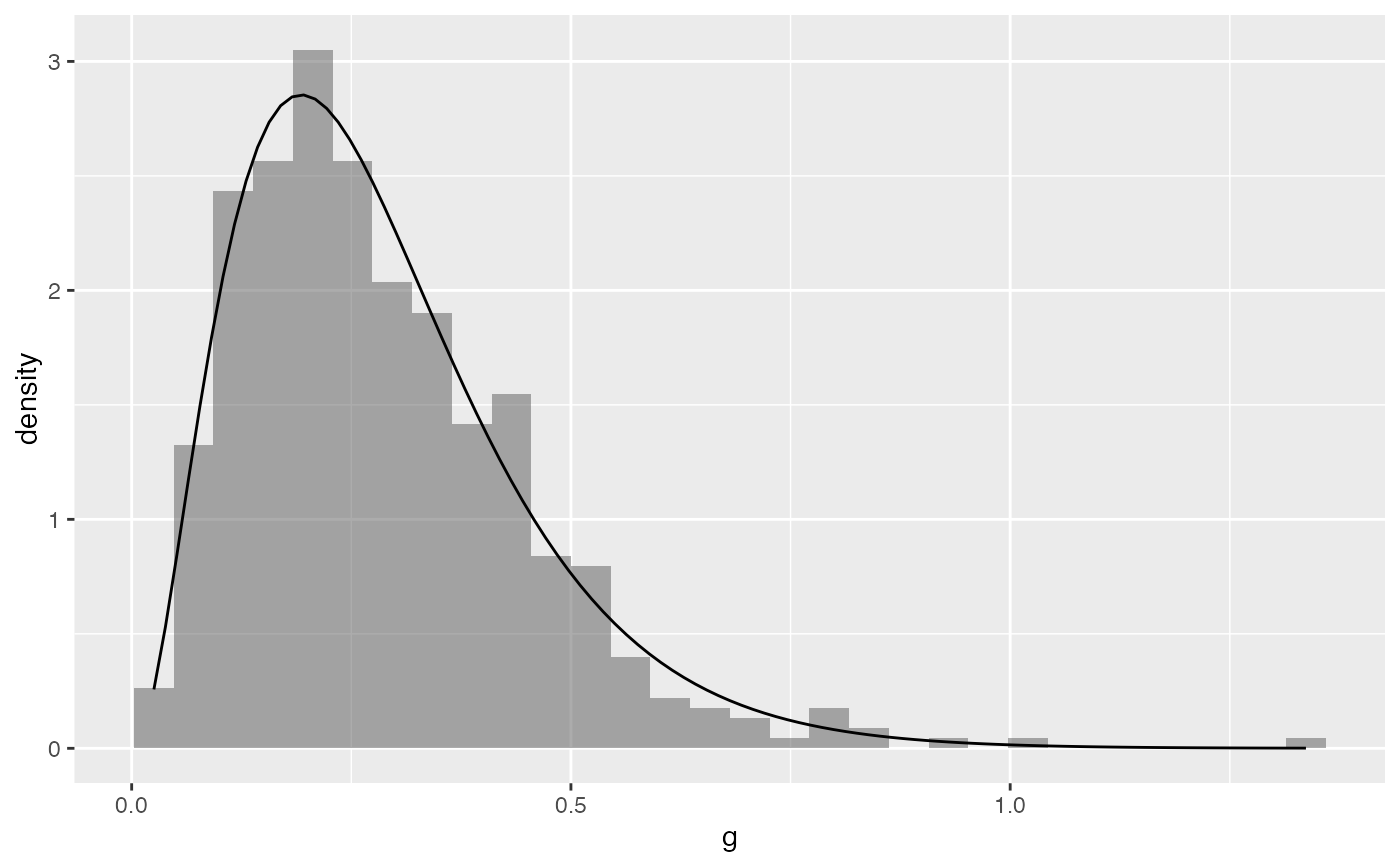
 fitted_density <- mosaicCore::fit_distr_fun(~g, data = Dat, dist = "dgamma")
gf_dhistogram(~g, data = Dat) |>
gf_fun(fitted_density(x) ~ x, inherit = FALSE)
#> `stat_bin()` using `bins = 30`. Pick better value `binwidth`.
fitted_density <- mosaicCore::fit_distr_fun(~g, data = Dat, dist = "dgamma")
gf_dhistogram(~g, data = Dat) |>
gf_fun(fitted_density(x) ~ x, inherit = FALSE)
#> `stat_bin()` using `bins = 30`. Pick better value `binwidth`.
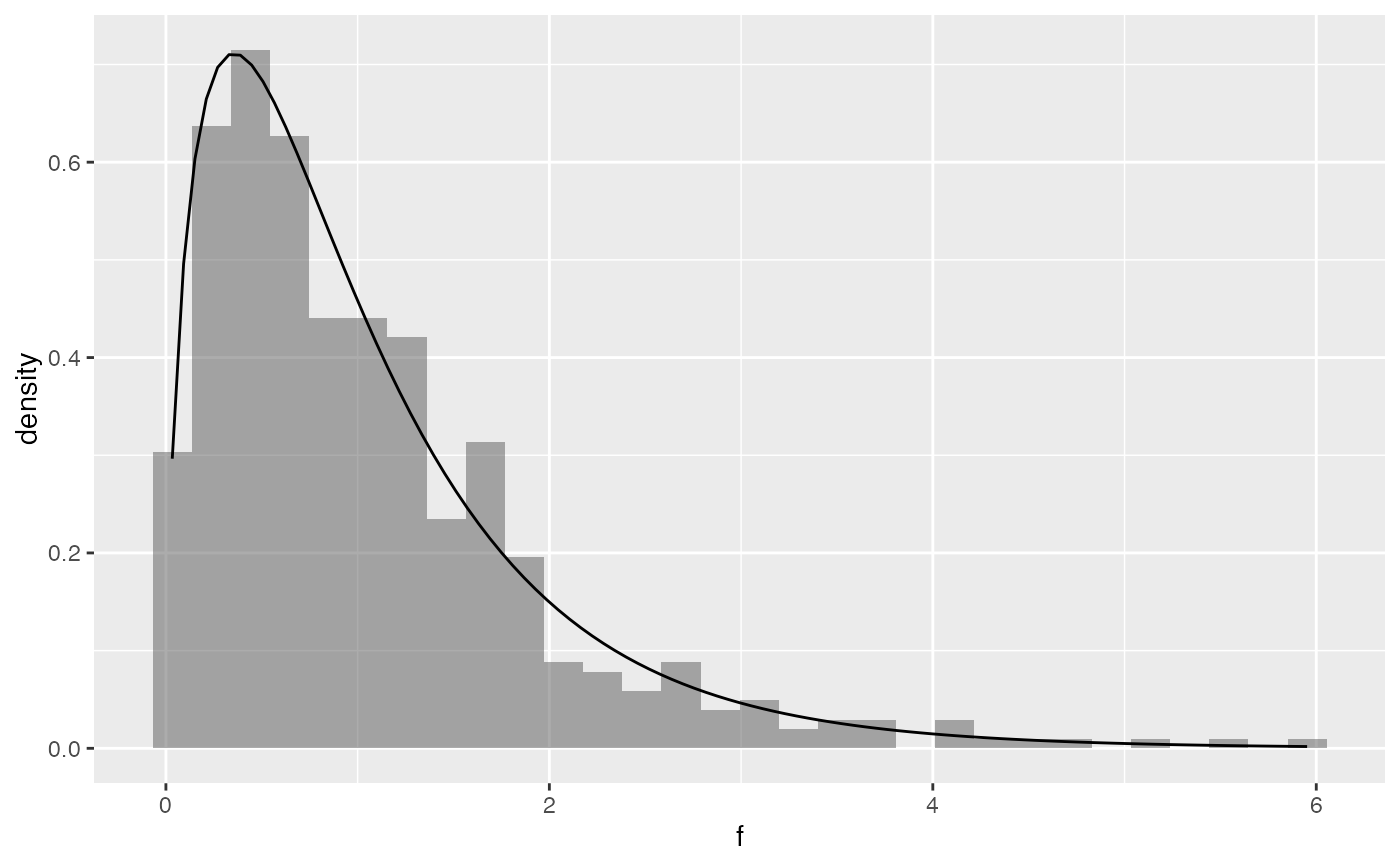
 gf_dhistogram(~f, data = Dat) |>
gf_fitdistr(dist = "df", start = list(df1 = 2, df2 = 50))
#> `stat_bin()` using `bins = 30`. Pick better value `binwidth`.
gf_dhistogram(~f, data = Dat) |>
gf_fitdistr(dist = "df", start = list(df1 = 2, df2 = 50))
#> `stat_bin()` using `bins = 30`. Pick better value `binwidth`.
 # fitted parameters are default argument values
args(
mosaicCore::fit_distr_fun(~f,
data = Dat, dist = "df",
start = list(df1 = 2, df2 = 50)
)
)
#> function (x, df1 = 3.20565570501803, df2 = 33.6603447625776,
#> ncp, log = FALSE)
#> NULL
args(mosaicCore::fit_distr_fun(~g, data = Dat, dist = "dgamma"))
#> function (x, shape = 3.06811349021412, rate = 10.7081791970509,
#> scale = 1/rate, log = FALSE)
#> NULL
# fitted parameters are default argument values
args(
mosaicCore::fit_distr_fun(~f,
data = Dat, dist = "df",
start = list(df1 = 2, df2 = 50)
)
)
#> function (x, df1 = 3.20565570501803, df2 = 33.6603447625776,
#> ncp, log = FALSE)
#> NULL
args(mosaicCore::fit_distr_fun(~g, data = Dat, dist = "dgamma"))
#> function (x, shape = 3.06811349021412, rate = 10.7081791970509,
#> scale = 1/rate, log = FALSE)
#> NULL