These functions modify things like labels, limits, scales, etc. for plots ggplot2 plots. They are wrappers around functions in ggplot2 that allow for chaining syntax.
Details
gf_refine() provides a mechanism to replace + with the
chaining/pipe operator |>.
Each of its \dots arguments is added in turn to the
base plot in object. The other functions are thin wrappers around
specific ggplot2 refinement functions and pass their \dots
arguments through to the similarly named ggplot2 functions.
Examples
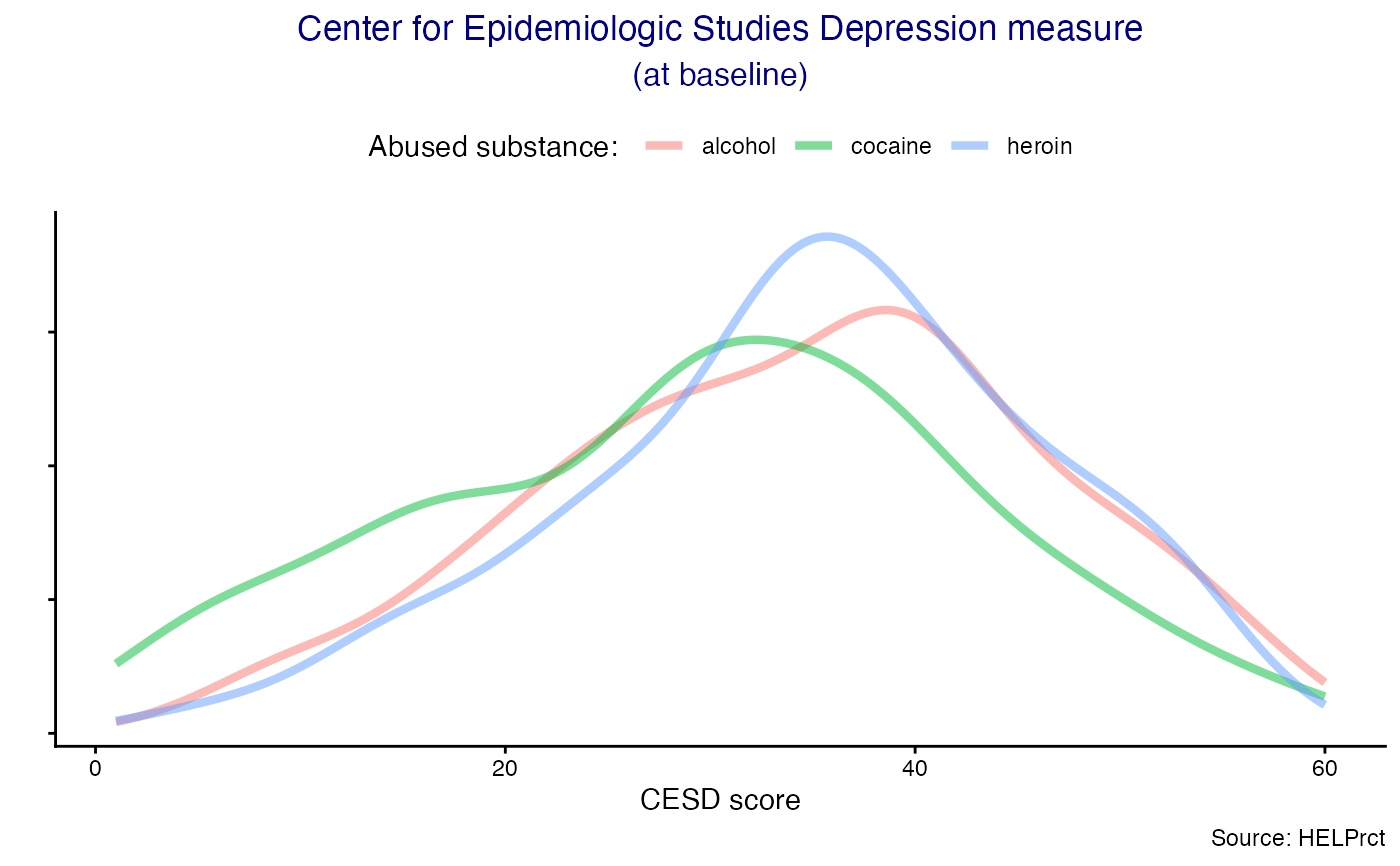
gf_dens(~cesd, color = ~substance, linewidth = 1.5, data = mosaicData::HELPrct) |>
gf_labs(
title = "Center for Epidemiologic Studies Depression measure",
subtitle = "(at baseline)",
color = "Abused substance: ",
x = "CESD score",
y = "",
caption = "Source: HELPrct"
) |>
gf_theme(theme_classic()) |>
gf_theme(
axis.text.y = element_blank(),
legend.position = "top",
plot.title = element_text(hjust = 0.5, color = "navy"),
plot.subtitle = element_text(hjust = 0.5, color = "navy", size = 12)
)
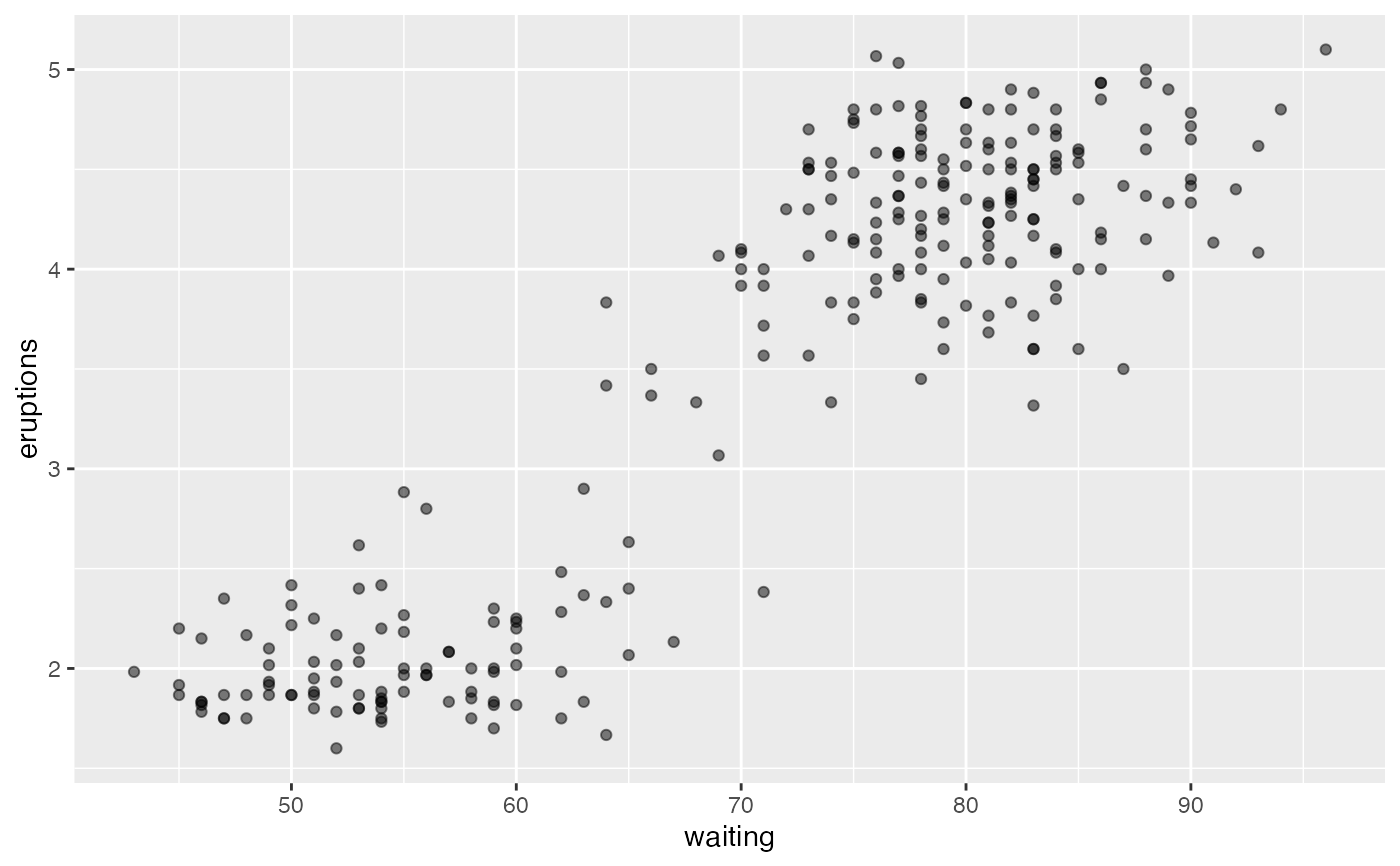
 gf_point(eruptions ~ waiting, data = faithful, alpha = 0.5)
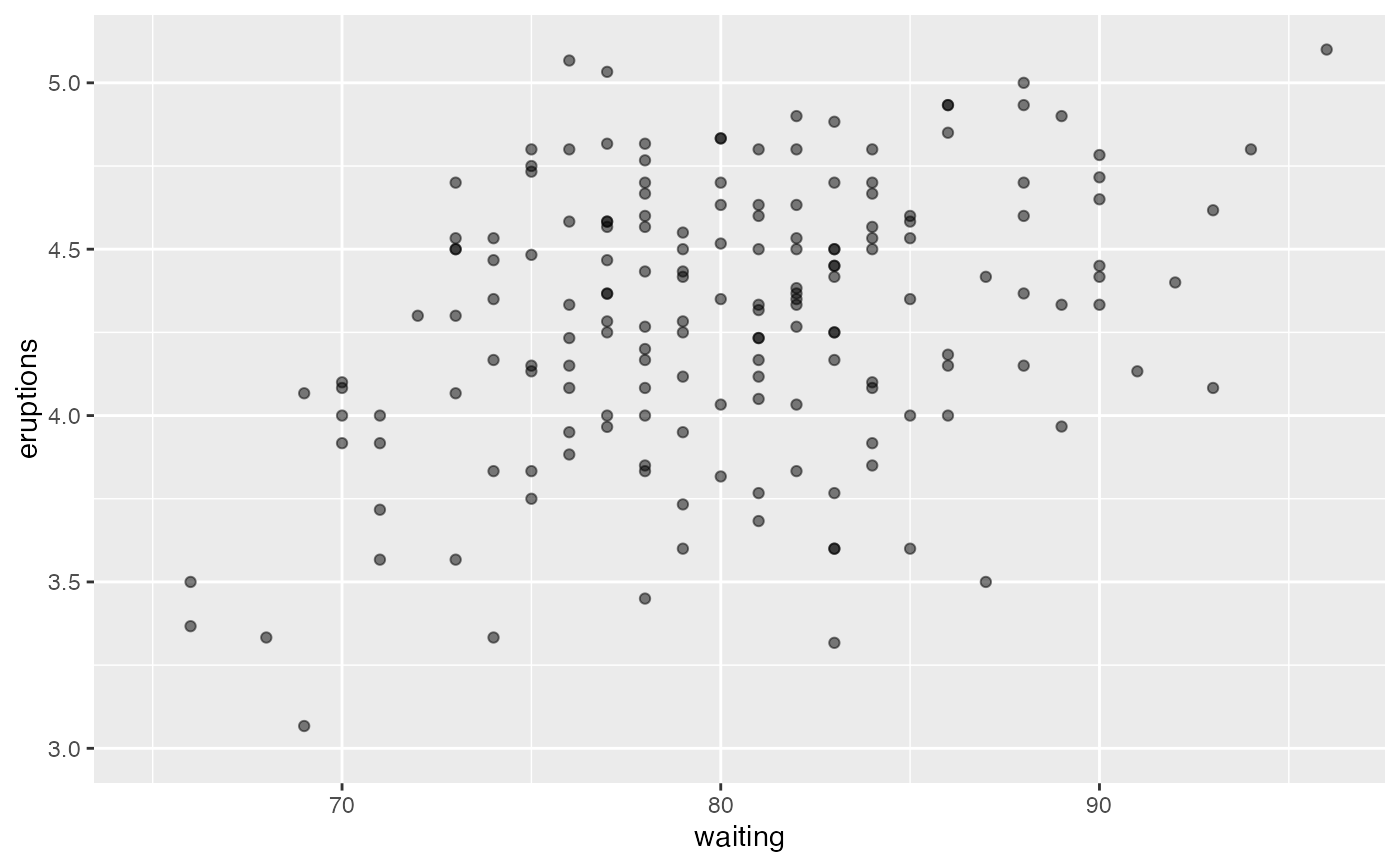
 gf_point(eruptions ~ waiting, data = faithful, alpha = 0.5) |>
gf_lims(x = c(65, NA), y = c(3, NA))
#> Warning: Removed 99 rows containing missing values or values outside the scale range
#> (`geom_point()`).
gf_point(eruptions ~ waiting, data = faithful, alpha = 0.5) |>
gf_lims(x = c(65, NA), y = c(3, NA))
#> Warning: Removed 99 rows containing missing values or values outside the scale range
#> (`geom_point()`).
 # modify scales using gf_refine()
data(penguins, package = "palmerpenguins")
gf_jitter(bill_length_mm ~ bill_depth_mm, color = ~species, data = penguins) |>
gf_refine(scale_color_brewer(type = "qual", palette = 3)) |>
gf_theme(theme_bw())
#> Warning: Removed 2 rows containing missing values or values outside the scale range
#> (`geom_point()`).
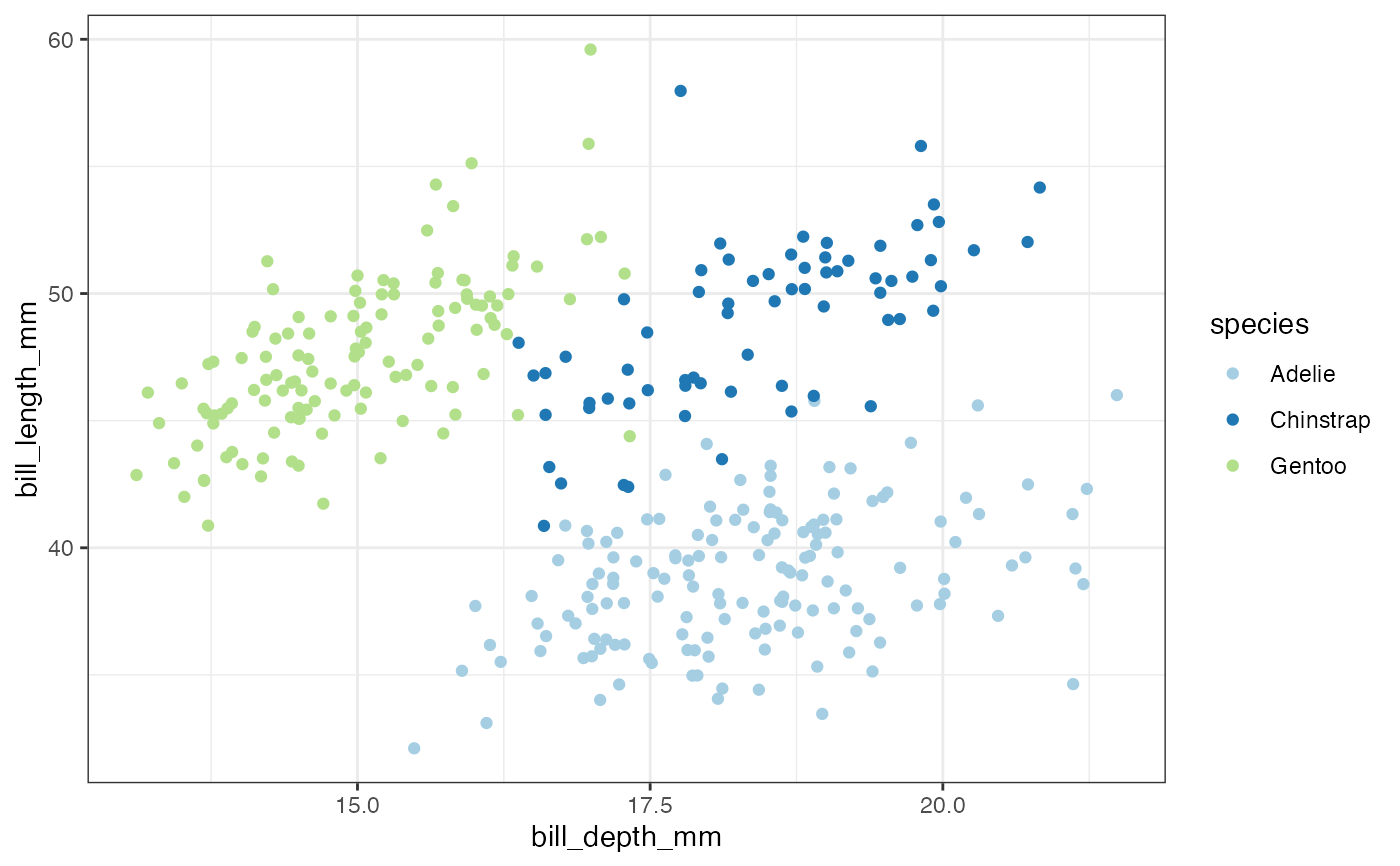
# modify scales using gf_refine()
data(penguins, package = "palmerpenguins")
gf_jitter(bill_length_mm ~ bill_depth_mm, color = ~species, data = penguins) |>
gf_refine(scale_color_brewer(type = "qual", palette = 3)) |>
gf_theme(theme_bw())
#> Warning: Removed 2 rows containing missing values or values outside the scale range
#> (`geom_point()`).
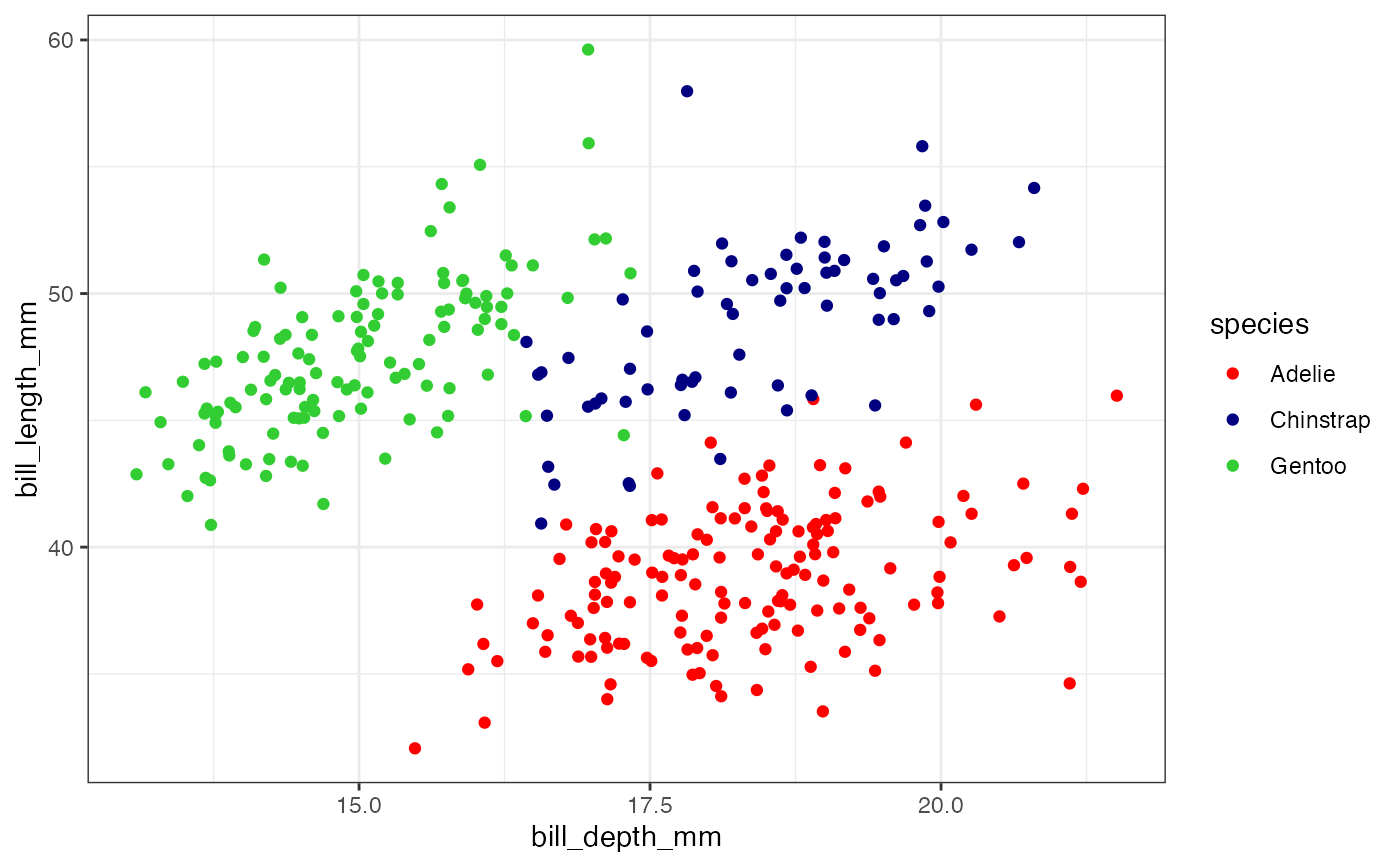
 gf_jitter(bill_length_mm ~ bill_depth_mm, color = ~species, data = penguins) |>
gf_refine(scale_color_manual(values = c("red", "navy", "limegreen"))) |>
gf_theme(theme_bw())
#> Warning: Removed 2 rows containing missing values or values outside the scale range
#> (`geom_point()`).
gf_jitter(bill_length_mm ~ bill_depth_mm, color = ~species, data = penguins) |>
gf_refine(scale_color_manual(values = c("red", "navy", "limegreen"))) |>
gf_theme(theme_bw())
#> Warning: Removed 2 rows containing missing values or values outside the scale range
#> (`geom_point()`).