geom_path() connects the observations in the order in which they appear
in the data. geom_line() connects them in order of the variable on the
x axis. geom_step() creates a stairstep plot, highlighting exactly
when changes occur. The group aesthetic determines which cases are
connected together.
Usage
gf_step(
  object = NULL,
  gformula = NULL,
  data = NULL,
  ...,
  alpha,
  color,
  group,
  linetype,
  linewidth,
  direction = "hv",
  xlab,
  ylab,
  title,
  subtitle,
  caption,
  geom = "step",
  stat = "identity",
  position = "identity",
  show.legend = NA,
  show.help = NULL,
  inherit = TRUE,
  environment = parent.frame()
)
Arguments
- object
When chaining, this holds an object produced in the earlier portions of the chain. Most users can safely ignore this argument. See details and examples.
- gformula
A formula with shape
y ~ x. Faceting can be achieved by including|in the formula.- data
The data to be displayed in this layer. There are three options:
If
NULL, the default, the data is inherited from the plot data as specified in the call toggplot().A
data.frame, or other object, will override the plot data. All objects will be fortified to produce a data frame. Seefortify()for which variables will be created.A
functionwill be called with a single argument, the plot data. The return value must be adata.frame, and will be used as the layer data. Afunctioncan be created from aformula(e.g.~ head(.x, 10)).- ...
Additional arguments. Typically these are (a) ggplot2 aesthetics to be set with
attribute = value, (b) ggplot2 aesthetics to be mapped withattribute = ~ expression, or (c) attributes of the layer as a whole, which are set withattribute = value.- alpha
Opacity (0 = invisible, 1 = opaque).
- color
A color or a formula used for mapping color.
- group
Used for grouping.
- linetype
A linetype (numeric or "dashed", "dotted", etc.) or a formula used for mapping linetype.
- linewidth
A numerical line width or a formula used for mapping linewidth.
- direction
direction of stairs: 'vh' for vertical then horizontal, 'hv' for horizontal then vertical, or 'mid' for step half-way between adjacent x-values.
- xlab
Label for x-axis. See also
gf_labs().- ylab
Label for y-axis. See also
gf_labs().- title, subtitle, caption
Title, sub-title, and caption for the plot. See also
gf_labs().- geom
A character string naming the geom used to make the layer.
- stat
The statistical transformation to use on the data for this layer. When using a
geom_*()function to construct a layer, thestatargument can be used to override the default coupling between geoms and stats. Thestatargument accepts the following:A
Statggproto subclass, for exampleStatCount.A string naming the stat. To give the stat as a string, strip the function name of the
stat_prefix. For example, to usestat_count(), give the stat as"count".For more information and other ways to specify the stat, see the layer stat documentation.
- position
A position adjustment to use on the data for this layer. This can be used in various ways, including to prevent overplotting and improving the display. The
positionargument accepts the following:The result of calling a position function, such as
position_jitter(). This method allows for passing extra arguments to the position.A string naming the position adjustment. To give the position as a string, strip the function name of the
position_prefix. For example, to useposition_jitter(), give the position as"jitter".For more information and other ways to specify the position, see the layer position documentation.
- show.legend
logical. Should this layer be included in the legends?
NA, the default, includes if any aesthetics are mapped.FALSEnever includes, andTRUEalways includes. It can also be a named logical vector to finely select the aesthetics to display. To include legend keys for all levels, even when no data exists, useTRUE. IfNA, all levels are shown in legend, but unobserved levels are omitted.- show.help
If
TRUE, display some minimal help.- inherit
A logical indicating whether default attributes are inherited.
- environment
An environment in which to look for variables not found in
data.
Specifying plot attributes
Positional attributes (a.k.a, aesthetics) are specified using the formula in gformula.
Setting and mapping of additional attributes can be done through the
use of additional arguments.
Attributes can be set can be set using arguments of the form attribute = value or
mapped using arguments of the form attribute = ~ expression.
In formulas of the form A | B, B will be used to form facets using
ggplot2::facet_wrap() or ggplot2::facet_grid().
This provides an alternative to
gf_facet_wrap() and
gf_facet_grid() that is terser and may feel more familiar to users
of lattice.
Evaluation
Evaluation of the ggplot2 code occurs in the environment of gformula.
This will typically do the right thing when formulas are created on the fly, but might not
be the right thing if formulas created in one environment are used to create plots
in another.
Examples
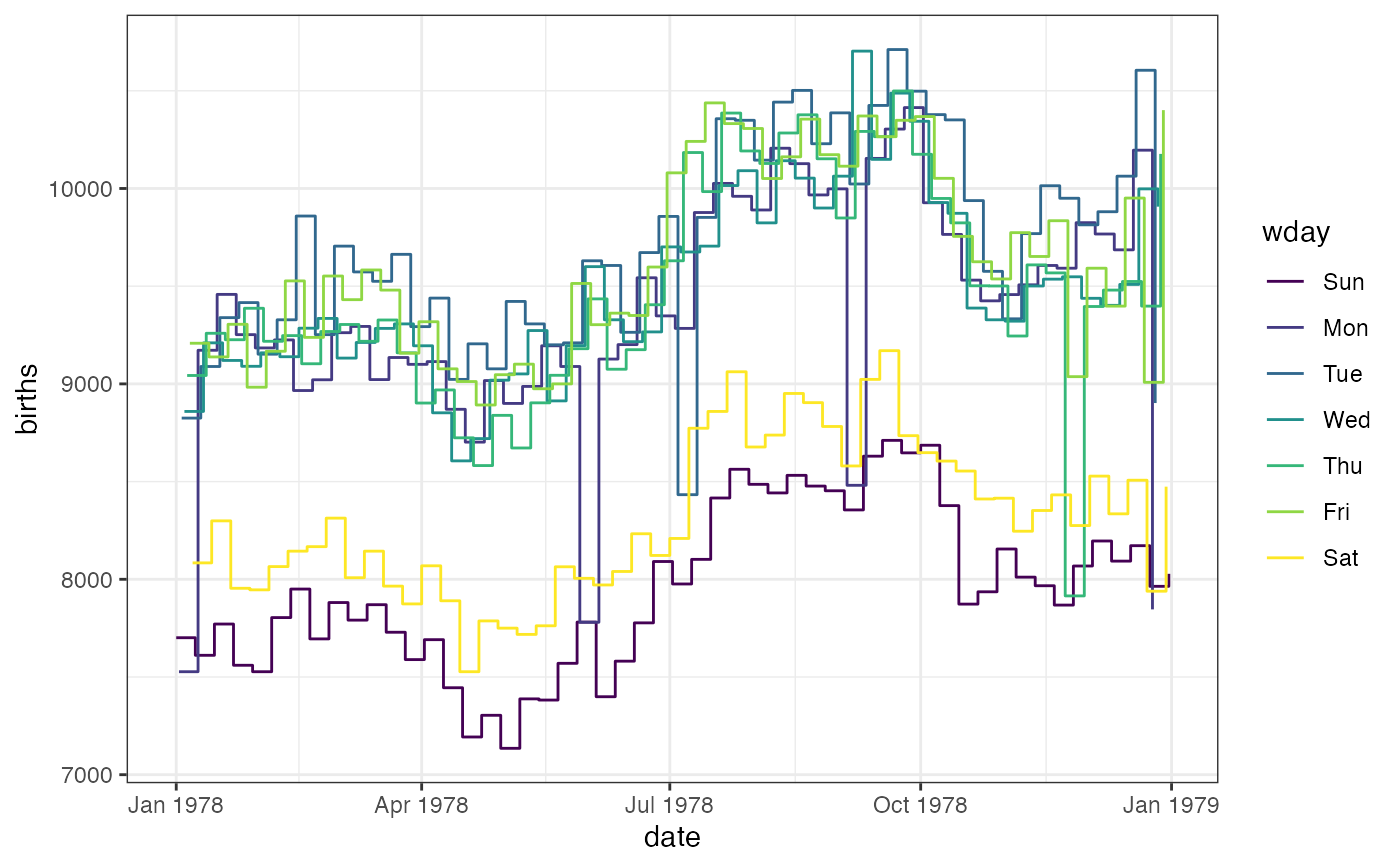
gf_step(births ~ date, data = mosaicData::Births78, color = ~wday)
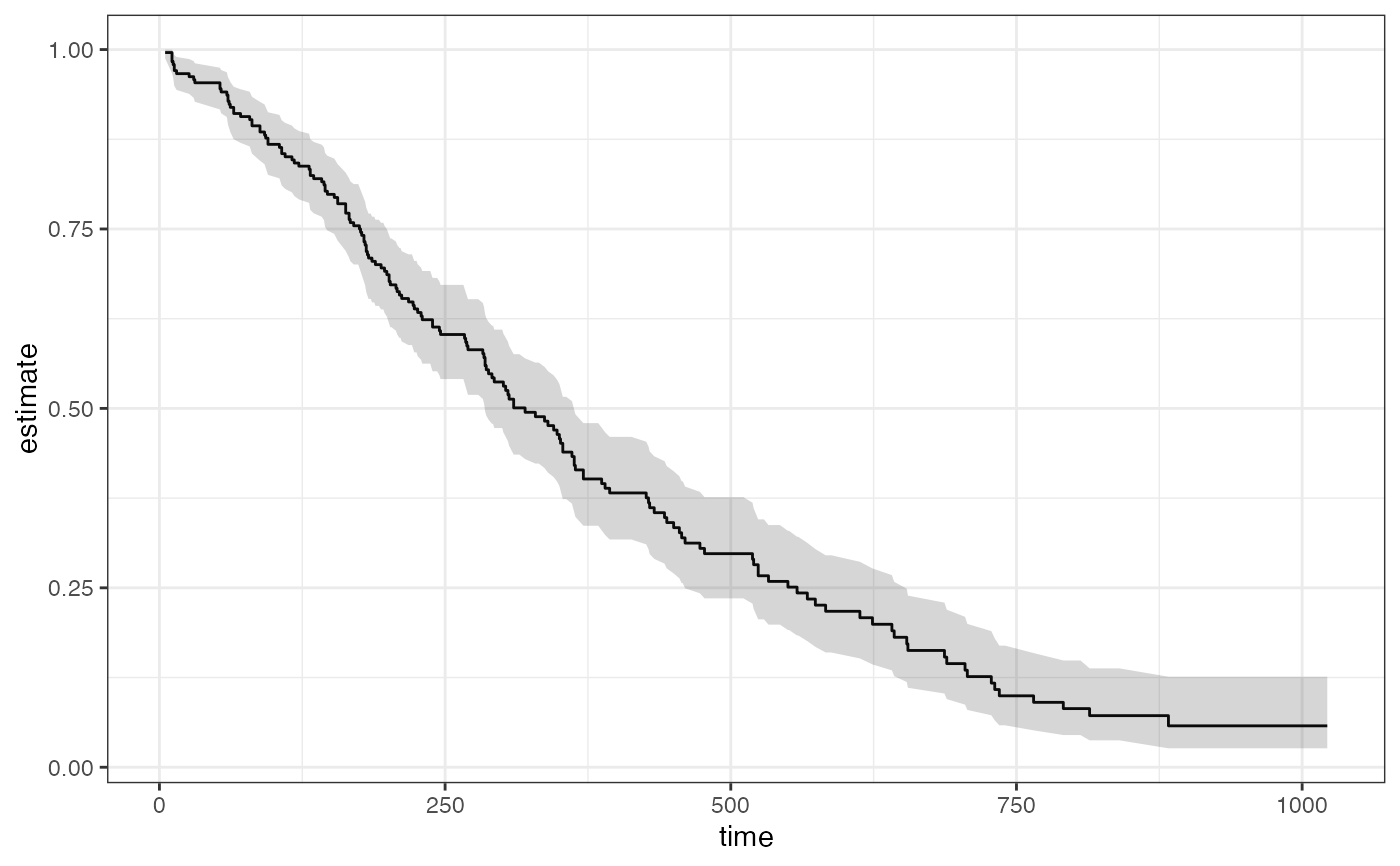
 # Roll your own Kaplan-Meier plot
if (require(survival) && require(broom)) {
# fit a survival model
surv_fit <- survfit(coxph(Surv(time, status) ~ age + sex, lung))
surv_fit
# use broom::tidy() to create a tidy data frame for plotting
surv_df <- tidy(surv_fit)
head(surv_df)
# now create a plot
surv_df |>
gf_step(estimate ~ time) |>
gf_ribbon(conf.low + conf.high ~ time, alpha = 0.2)
}
#> Loading required package: survival
#> Loading required package: broom
# Roll your own Kaplan-Meier plot
if (require(survival) && require(broom)) {
# fit a survival model
surv_fit <- survfit(coxph(Surv(time, status) ~ age + sex, lung))
surv_fit
# use broom::tidy() to create a tidy data frame for plotting
surv_df <- tidy(surv_fit)
head(surv_df)
# now create a plot
surv_df |>
gf_step(estimate ~ time) |>
gf_ribbon(conf.low + conf.high ~ time, alpha = 0.2)
}
#> Loading required package: survival
#> Loading required package: broom