Scatterplots in ggformula.
Usage
gf_dotplot(
  object = NULL,
  gformula = NULL,
  data = NULL,
  ...,
  alpha,
  color,
  fill,
  group,
  binwidth = NULL,
  binaxis = "x",
  method = "dotdensity",
  binpositions = "bygroup",
  stackdir = "up",
  stackratio = 1,
  dotsize = 1,
  stackgroups = FALSE,
  origin = NULL,
  right = TRUE,
  width = 0.9,
  drop = FALSE,
  xlab,
  ylab,
  title,
  subtitle,
  caption,
  position = "identity",
  show.legend = NA,
  show.help = NULL,
  inherit = TRUE,
  environment = parent.frame()
)
Arguments
- object
When chaining, this holds an object produced in the earlier portions of the chain. Most users can safely ignore this argument. See details and examples.
- gformula
A formula with shape
~ x. Faceting can be achieved by including|in the formula.- data
A data frame with the variables to be plotted.
- ...
Additional arguments. Typically these are (a) ggplot2 aesthetics to be set with
attribute = value, (b) ggplot2 aesthetics to be mapped withattribute = ~ expression, or (c) attributes of the layer as a whole, which are set withattribute = value.- alpha
Opacity (0 = invisible, 1 = opaque).
- color
A color or a formula used for mapping color.
- fill
A color for filling, or a formula used for mapping fill.
- group
Used for grouping.
- binwidth
When
methodis "dotdensity", this specifies maximum bin width. Whenmethodis "histodot", this specifies bin width. Defaults to 1/30 of the range of the data- binaxis
The axis to bin along, "x" (default) or "y"
- method
"dotdensity" (default) for dot-density binning, or "histodot" for fixed bin widths (like stat_bin)
- binpositions
When
methodis "dotdensity", "bygroup" (default) determines positions of the bins for each group separately. "all" determines positions of the bins with all the data taken together; this is used for aligning dot stacks across multiple groups.- stackdir
which direction to stack the dots. "up" (default), "down", "center", "centerwhole" (centered, but with dots aligned)
- stackratio
how close to stack the dots. Default is 1, where dots just touch. Use smaller values for closer, overlapping dots.
- dotsize
The diameter of the dots relative to
binwidth, default 1.- stackgroups
should dots be stacked across groups? This has the effect that
position = "stack"should have, but can't (because this geom has some odd properties).- origin
When
methodis "histodot", origin of first bin- right
When
methodis "histodot", should intervals be closed on the right (a, b], or not [a, b)- width
When
binaxisis "y", the spacing of the dot stacks for dodging.- drop
If TRUE, remove all bins with zero counts
- xlab
Label for x-axis. See also
gf_labs().- ylab
Label for y-axis. See also
gf_labs().- title, subtitle, caption
Title, sub-title, and caption for the plot. See also
gf_labs().- position
Either a character string naming the position function used for the layer or a position object returned from a call to a position function.
- show.legend
A logical indicating whether this layer should be included in the legends.
NA, the default, includes layer in the legends if any of the attributes of the layer are mapped.- show.help
If
TRUE, display some minimal help.- inherit
A logical indicating whether default attributes are inherited.
- environment
An environment in which to look for variables not found in
data.
Details
There are two basic approaches: dot-density and histodot.
With dot-density binning, the bin positions are determined by the data and
binwidth, which is the maximum width of each bin. See Wilkinson
(1999) for details on the dot-density binning algorithm. With histodot
binning, the bins have fixed positions and fixed widths, much like a
histogram.
When binning along the x axis and stacking along the y axis, the numbers on y axis are not meaningful, due to technical limitations of ggplot2. You can hide the y axis, as in one of the examples, or manually scale it to match the number of dots.
Warning
Dotplots in ggplot2 (and hence in ggformula) often require some fiddling because
the default y-axis is meaningless and the ideal size of the dots depends on the
aspect ratio of the plot.
Specifying plot attributes
Positional attributes (a.k.a, aesthetics) are specified using the formula in gformula.
Setting and mapping of additional attributes can be done through the
use of additional arguments.
Attributes can be set can be set using arguments of the form attribute = value or
mapped using arguments of the form attribute = ~ expression.
In formulas of the form A | B, B will be used to form facets using
ggplot2::facet_wrap() or ggplot2::facet_grid().
This provides an alternative to
gf_facet_wrap() and
gf_facet_grid() that is terser and may feel more familiar to users
of lattice.
Evaluation
Evaluation of the ggplot2 code occurs in the environment of gformula.
This will typically do the right thing when formulas are created on the fly, but might not
be the right thing if formulas created in one environment are used to create plots
in another.
Examples
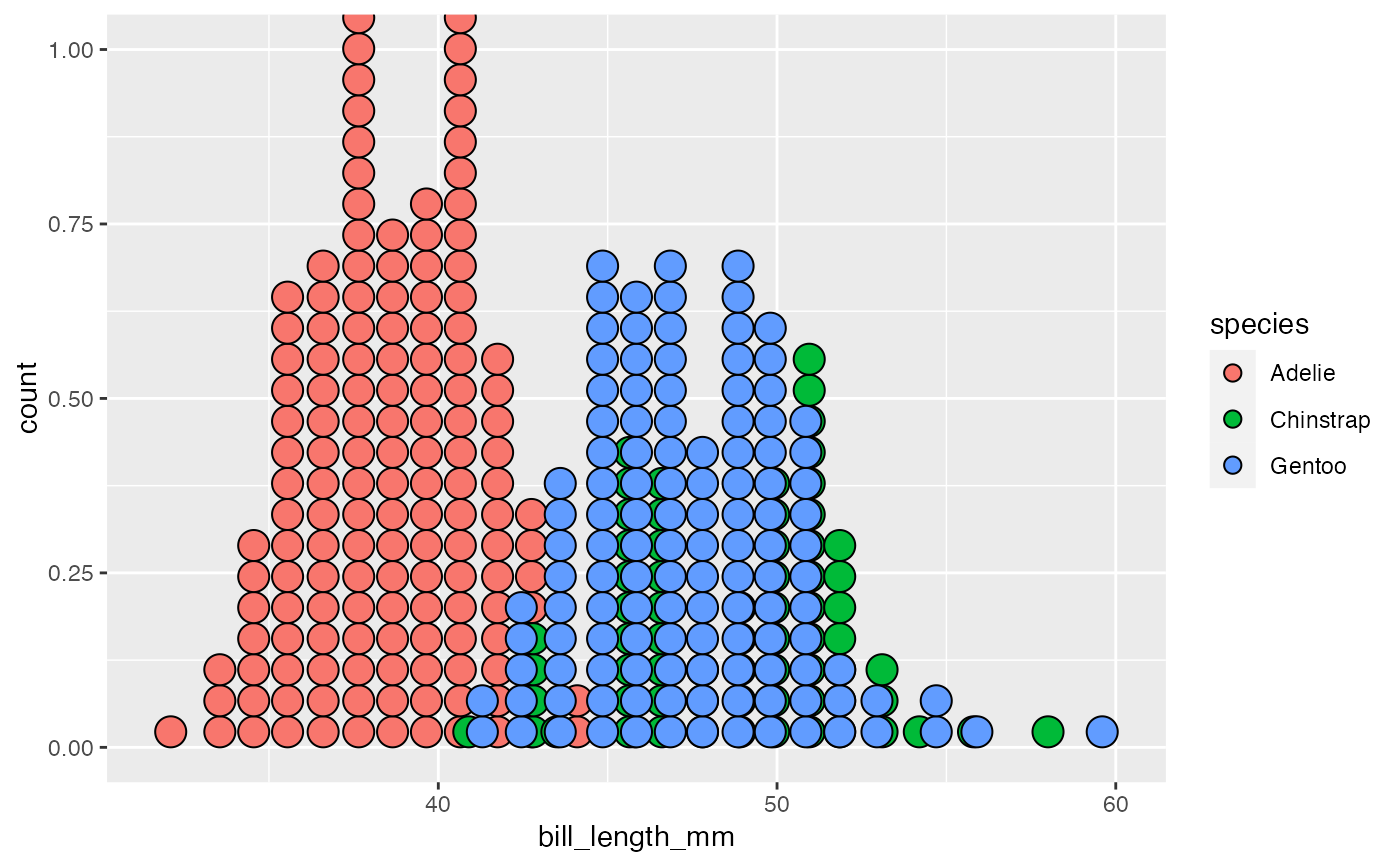
data(penguins, package = "palmerpenguins")
gf_dotplot(~bill_length_mm, fill = ~species, data = penguins)
#> Bin width defaults to 1/30 of the range of the data. Pick better value with
#> `binwidth`.
#> Warning: Removed 2 rows containing missing values or values outside the scale range
#> (`stat_bindot()`).