Formula interface to ggridges plots
Usage
gf_ridgeline(
  object = NULL,
  gformula = NULL,
  data = NULL,
  ...,
  height,
  scale = 1,
  min_height = 0,
  color,
  fill,
  alpha,
  group,
  linetype,
  linewidth,
  point_size,
  point_shape,
  point_colour,
  point_fill,
  point_alpha,
  point_stroke,
  xlab,
  ylab,
  title,
  subtitle,
  caption,
  geom = "ridgeline",
  stat = "identity",
  position = "identity",
  show.legend = NA,
  show.help = NULL,
  inherit = TRUE,
  environment = parent.frame()
)

gf_density_ridges(
  object = NULL,
  gformula = NULL,
  data = NULL,
  ...,
  height,
  scale = 1,
  rel_min_height = 0,
  color,
  fill,
  alpha,
  group,
  linetype,
  linewidth,
  point_size,
  point_shape,
  point_colour,
  point_fill,
  point_alpha,
  point_stroke,
  panel_scaling = TRUE,
  xlab,
  ylab,
  title,
  subtitle,
  caption,
  geom = "density_ridges",
  stat = "density_ridges",
  position = "points_sina",
  show.legend = NA,
  show.help = NULL,
  inherit = TRUE,
  environment = parent.frame()
)

gf_density_ridges2(
  object = NULL,
  gformula = NULL,
  data = NULL,
  ...,
  height,
  scale = 1,
  rel_min_height = 0,
  color,
  fill,
  alpha,
  group,
  linetype,
  linewidth,
  point_size,
  point_shape,
  point_colour,
  point_fill,
  point_alpha,
  point_stroke,
  panel_scaling = TRUE,
  xlab,
  ylab,
  title,
  subtitle,
  caption,
  geom = "density_ridges2",
  stat = "density_ridges",
  position = "points_sina",
  show.legend = NA,
  show.help = NULL,
  inherit = TRUE,
  environment = parent.frame()
)

gf_density_ridgeline_gradient(
  object = NULL,
  gformula = NULL,
  data = NULL,
  ...,
  height,
  color,
  fill,
  alpha,
  group,
  linetype,
  linewidth,
  gradient_lwd = 0.5,
  xlab,
  ylab,
  title,
  subtitle,
  caption,
  geom = "ridgeline_gradient",
  stat = "identity",
  position = "identity",
  show.legend = NA,
  show.help = NULL,
  inherit = TRUE,
  environment = parent.frame()
)

gf_density_ridges_gradient(
  object = NULL,
  gformula = NULL,
  data = NULL,
  ...,
  height,
  panel_scaling = TRUE,
  color,
  fill = ~stat(x),
  alpha,
  group,
  linetype,
  linewidth,
  gradient_lwd = 0.5,
  xlab,
  ylab,
  title,
  subtitle,
  caption,
  geom = "density_ridges_gradient",
  stat = "density_ridges",
  position = "points_sina",
  show.legend = NA,
  show.help = NULL,
  inherit = TRUE,
  environment = parent.frame()
)
Arguments
- object
When chaining, this holds an object produced in the earlier portions of the chain. Most users can safely ignore this argument. See details and examples.
- gformula
A formula with shape
~ x. Faceting can be achieved by including|in the formula.- data
The data to be displayed in this layer. There are three options:
If
NULL, the default, the data is inherited from the plot data as specified in the call toggplot().A
data.frame, or other object, will override the plot data. All objects will be fortified to produce a data frame. Seefortify()for which variables will be created.A
functionwill be called with a single argument, the plot data. The return value must be adata.frame, and will be used as the layer data. Afunctioncan be created from aformula(e.g.~ head(.x, 10)).- ...
Additional arguments. Typically these are (a) ggplot2 aesthetics to be set with
attribute = value, (b) ggplot2 aesthetics to be mapped withattribute = ~ expression, or (c) attributes of the layer as a whole, which are set withattribute = value.- height
The height of each ridgeline at the respective x value. Automatically calculated and provided by
ggridges::stat_density_ridges()if the default stat is not changed.- scale
A scaling factor to scale the height of the ridgelines relative to the spacing between them. A value of 1 indicates that the maximum point of any ridgeline touches the baseline right above, assuming even spacing between baselines.
- min_height
A height cutoff on the drawn ridgelines. All values that fall below this cutoff will be removed. The main purpose of this cutoff is to remove long tails right at the baseline level, but other uses are possible. The cutoff is applied before any height scaling is applied via the scale aesthetic. Default is 0, so negative values are removed.
- color
A color or a formula used for mapping color.
- fill
A color for filling, or a formula used for mapping fill.
- alpha
Opacity (0 = invisible, 1 = opaque).
- group
Used for grouping.
- linetype
A linetype (numeric or "dashed", "dotted", etc.) or a formula used for mapping linetype.
- linewidth
A numerical line width or a formula used for mapping linewidth.
- point_shape, point_colour, point_size, point_fill, point_alpha, point_stroke
As in
ggridges::geom_ridgeline().- xlab
Label for x-axis. See also
gf_labs().- ylab
Label for y-axis. See also
gf_labs().- title, subtitle, caption
Title, sub-title, and caption for the plot. See also
gf_labs().- geom, stat
Use to override the default connection between
geom_density()andstat_density(). For more information about overriding these connections, see how the stat and geom arguments work.- position
A position adjustment to use on the data for this layer. This can be used in various ways, including to prevent overplotting and improving the display. The
positionargument accepts the following:The result of calling a position function, such as
position_jitter(). This method allows for passing extra arguments to the position.A string naming the position adjustment. To give the position as a string, strip the function name of the
position_prefix. For example, to useposition_jitter(), give the position as"jitter".For more information and other ways to specify the position, see the layer position documentation.
- show.legend
logical. Should this layer be included in the legends?
NA, the default, includes if any aesthetics are mapped.FALSEnever includes, andTRUEalways includes. It can also be a named logical vector to finely select the aesthetics to display. To include legend keys for all levels, even when no data exists, useTRUE. IfNA, all levels are shown in legend, but unobserved levels are omitted.- show.help
If
TRUE, display some minimal help.- inherit
A logical indicating whether default attributes are inherited.
- environment
An environment in which to look for variables not found in
data.- rel_min_height
Lines with heights below this cutoff will be removed. The cutoff is measured relative to the overall maximum, so
rel_min_height = 0.01would remove everything. Default is 0, so nothing is removed.- panel_scaling
If
TRUE, the default, relative scaling is calculated separately for each panel. IfFALSE, relative scaling is calculated globally.- gradient_lwd
A parameter to needed to remove rendering artifacts inside the rendered gradients. Should ideally be 0, but often needs to be around 0.5 or higher.
Details
Note that the ggridges::stat_density_ridges() makes joint density estimation
across all datasets. This may not generate the desired result when using
faceted plots. As an alternative, you can set stat = "density" to use
ggplot2::stat_density(). In this case, it is required to add the aesthetic mapping
height = after_stat(density) (see examples).
Examples
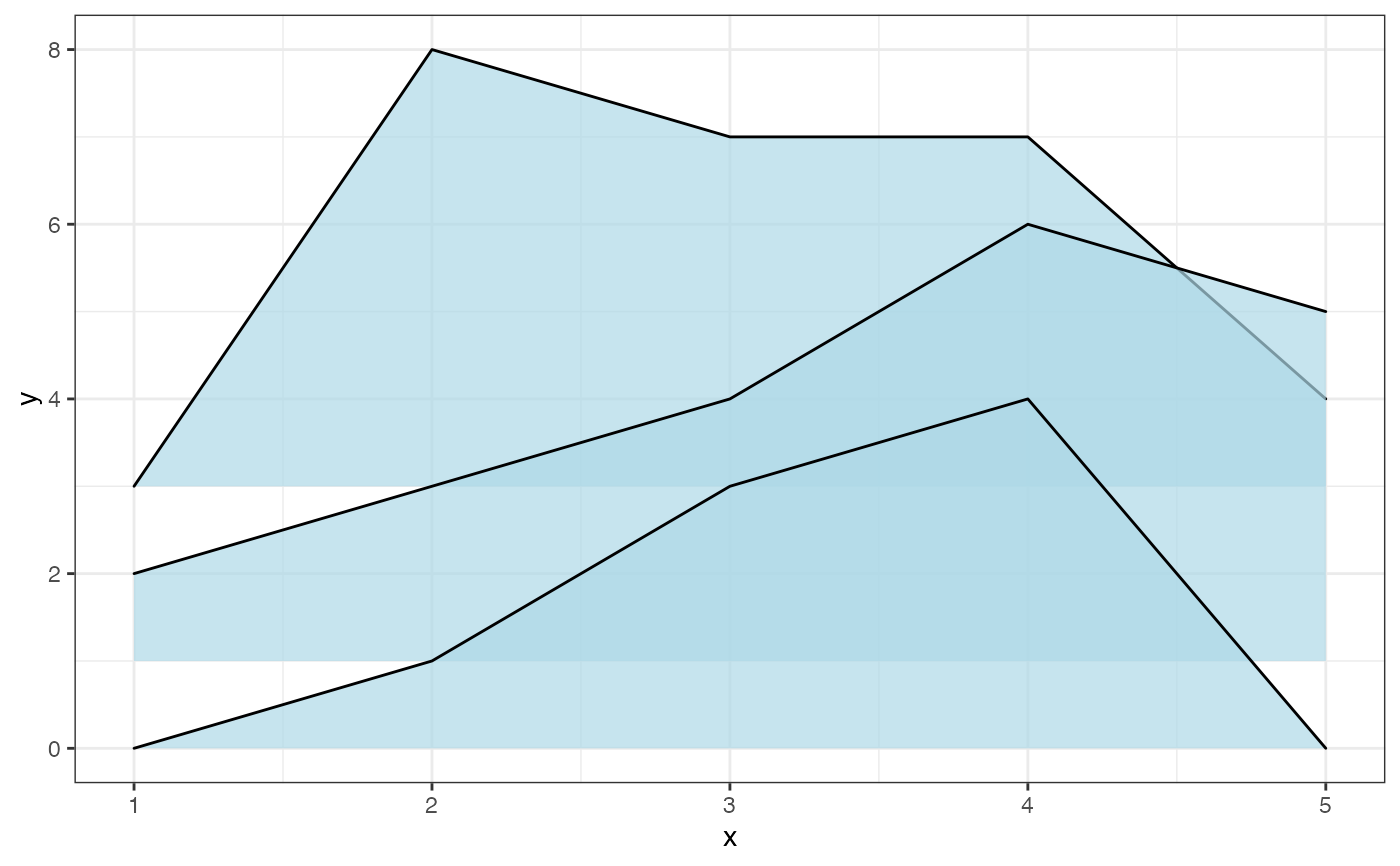
data.frame(
x = rep(1:5, 3), y = c(rep(0, 5), rep(1, 5), rep(3, 5)),
height = c(0, 1, 3, 4, 0, 1, 2, 3, 5, 4, 0, 5, 4, 4, 1)
) |>
gf_ridgeline(y ~ x, height = ~ height, group = ~y, fill = "lightblue", alpha = 0.7)
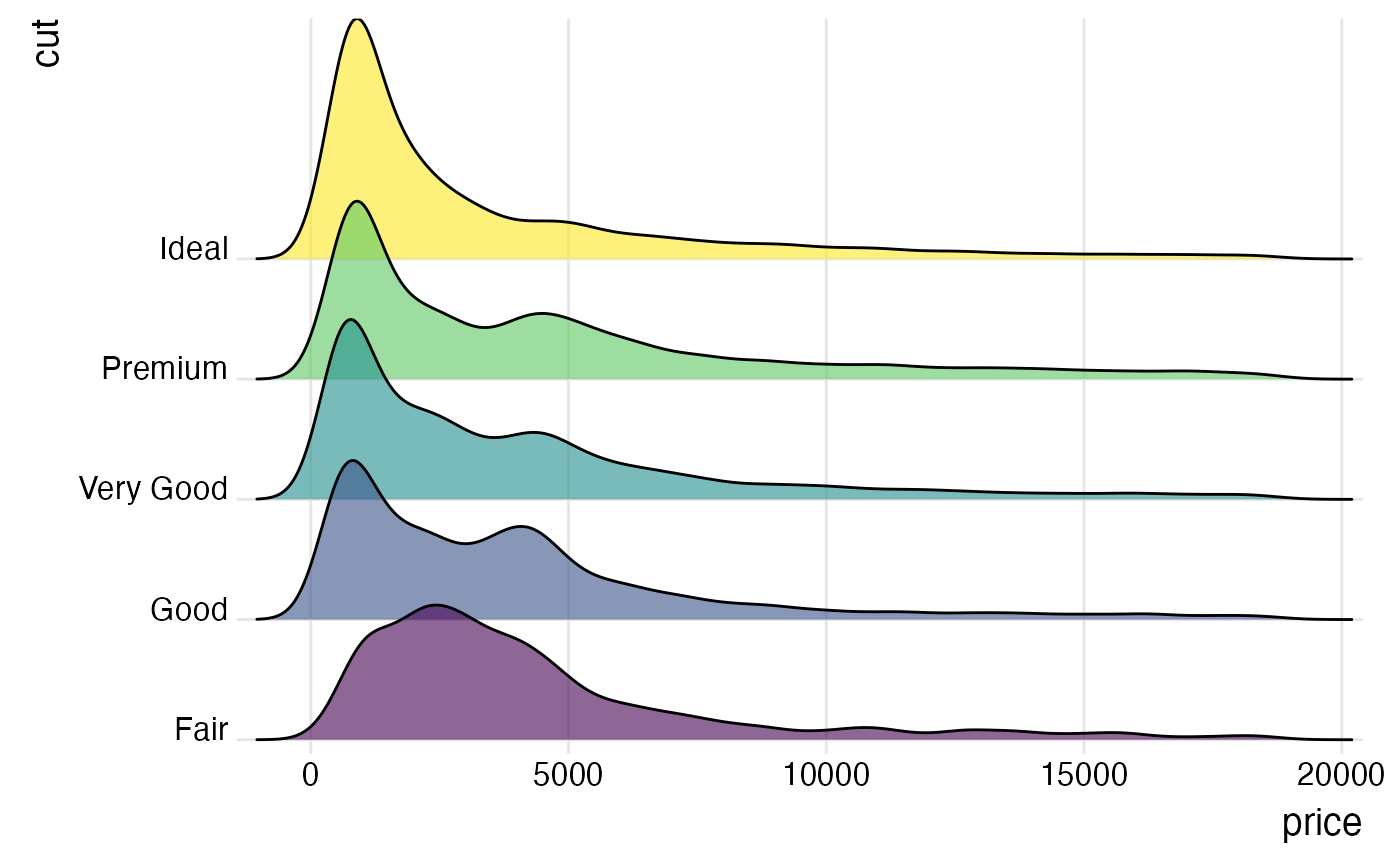
 diamonds |>
gf_density_ridges(cut ~ price,
scale = 2, fill = ~ cut, alpha = 0.6, show.legend = FALSE) |>
gf_theme(theme_ridges()) |>
gf_refine(
scale_y_discrete(expand = c(0.01, 0)),
scale_x_continuous(expand = c(0.01, 0))
)
#> Picking joint bandwidth of 458
diamonds |>
gf_density_ridges(cut ~ price,
scale = 2, fill = ~ cut, alpha = 0.6, show.legend = FALSE) |>
gf_theme(theme_ridges()) |>
gf_refine(
scale_y_discrete(expand = c(0.01, 0)),
scale_x_continuous(expand = c(0.01, 0))
)
#> Picking joint bandwidth of 458
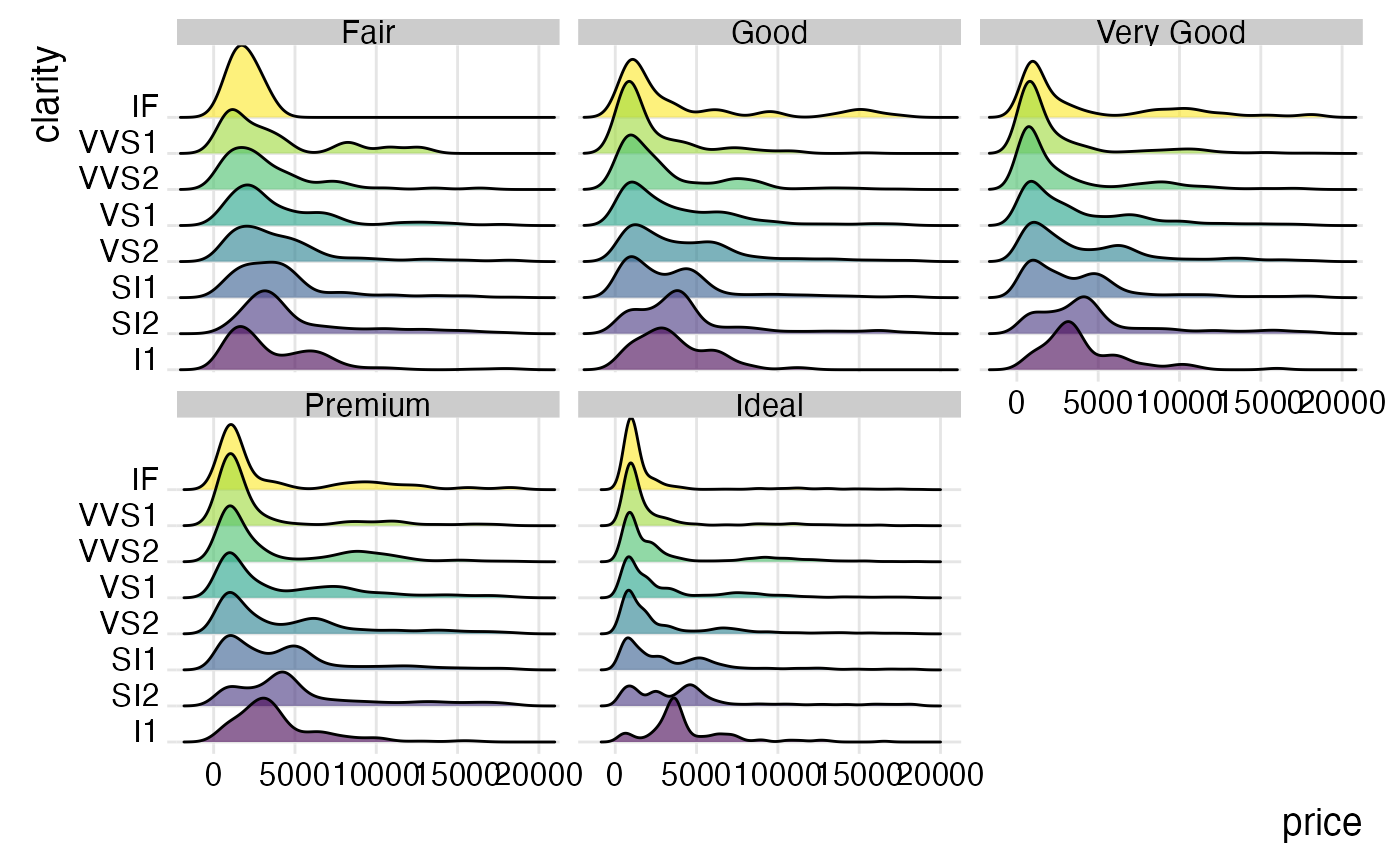
 diamonds |>
gf_density_ridges(clarity ~ price | cut,
scale = 2, fill = ~ clarity, alpha = 0.6, show.legend = FALSE) |>
gf_theme(theme_ridges()) |>
gf_refine(
scale_y_discrete(expand = c(0.01, 0)),
scale_x_continuous(expand = c(0.01, 0))
)
#> Picking joint bandwidth of 796
#> Picking joint bandwidth of 751
#> Picking joint bandwidth of 677
#> Picking joint bandwidth of 718
#> Picking joint bandwidth of 400
diamonds |>
gf_density_ridges(clarity ~ price | cut,
scale = 2, fill = ~ clarity, alpha = 0.6, show.legend = FALSE) |>
gf_theme(theme_ridges()) |>
gf_refine(
scale_y_discrete(expand = c(0.01, 0)),
scale_x_continuous(expand = c(0.01, 0))
)
#> Picking joint bandwidth of 796
#> Picking joint bandwidth of 751
#> Picking joint bandwidth of 677
#> Picking joint bandwidth of 718
#> Picking joint bandwidth of 400
 if (FALSE) { # \dontrun{
diamonds |>
gf_density_ridges(clarity ~ price | cut, height = ~after_stat(density), stat = "density",
scale = 2, fill = ~ clarity, alpha = 0.6, show.legend = FALSE) |>
gf_theme(theme_ridges()) |>
gf_refine(
scale_y_discrete(expand = c(0.01, 0)),
scale_x_continuous(expand = c(0.01, 0))
)
} # }
if (FALSE) { # \dontrun{
diamonds |>
gf_density_ridges2(cut ~ price, scale = 2, fill = ~ cut, alpha = 0.6, show.legend = FALSE) |>
gf_theme(theme_ridges()) |>
gf_refine(
scale_y_discrete(expand = c(0.01, 0)),
scale_x_continuous(expand = c(0.01, 0))
)
} # }
diamonds |>
gf_density_ridges(cut ~ price,
scale = 2, fill = ~ cut, alpha = 0.6, show.legend = FALSE) |>
gf_theme(theme_ridges()) |>
gf_refine(
scale_y_discrete(expand = c(0.01, 0)),
scale_x_continuous(expand = c(0.01, 0))
)
#> Picking joint bandwidth of 458
if (FALSE) { # \dontrun{
diamonds |>
gf_density_ridges(clarity ~ price | cut, height = ~after_stat(density), stat = "density",
scale = 2, fill = ~ clarity, alpha = 0.6, show.legend = FALSE) |>
gf_theme(theme_ridges()) |>
gf_refine(
scale_y_discrete(expand = c(0.01, 0)),
scale_x_continuous(expand = c(0.01, 0))
)
} # }
if (FALSE) { # \dontrun{
diamonds |>
gf_density_ridges2(cut ~ price, scale = 2, fill = ~ cut, alpha = 0.6, show.legend = FALSE) |>
gf_theme(theme_ridges()) |>
gf_refine(
scale_y_discrete(expand = c(0.01, 0)),
scale_x_continuous(expand = c(0.01, 0))
)
} # }
diamonds |>
gf_density_ridges(cut ~ price,
scale = 2, fill = ~ cut, alpha = 0.6, show.legend = FALSE) |>
gf_theme(theme_ridges()) |>
gf_refine(
scale_y_discrete(expand = c(0.01, 0)),
scale_x_continuous(expand = c(0.01, 0))
)
#> Picking joint bandwidth of 458
 diamonds |>
gf_density_ridges(clarity ~ price | cut,
scale = 2, fill = ~ clarity, alpha = 0.6, show.legend = FALSE) |>
gf_theme(theme_ridges()) |>
gf_refine(
scale_y_discrete(expand = c(0.01, 0)),
scale_x_continuous(expand = c(0.01, 0))
)
#> Picking joint bandwidth of 796
#> Picking joint bandwidth of 751
#> Picking joint bandwidth of 677
#> Picking joint bandwidth of 718
#> Picking joint bandwidth of 400
diamonds |>
gf_density_ridges(clarity ~ price | cut,
scale = 2, fill = ~ clarity, alpha = 0.6, show.legend = FALSE) |>
gf_theme(theme_ridges()) |>
gf_refine(
scale_y_discrete(expand = c(0.01, 0)),
scale_x_continuous(expand = c(0.01, 0))
)
#> Picking joint bandwidth of 796
#> Picking joint bandwidth of 751
#> Picking joint bandwidth of 677
#> Picking joint bandwidth of 718
#> Picking joint bandwidth of 400
 if (FALSE) { # \dontrun{
diamonds |>
gf_density_ridges(clarity ~ price | cut, height = ~ after_stat(density), stat = "density",
scale = 2, fill = ~ clarity, alpha = 0.6, show.legend = FALSE) |>
gf_theme(theme_ridges()) |>
gf_refine(
scale_y_discrete(expand = c(0.01, 0)),
scale_x_continuous(expand = c(0.01, 0))
)
} # }
if (FALSE) { # \dontrun{
mosaicData::Weather |>
gf_density_ridges_gradient(month ~ high_temp | city ~ ., fill = ~stat(x),
group = ~ month, show.legend = FALSE, rel_min_height = 0.02) |>
gf_refine(scale_fill_viridis_c(option = "B"), theme_bw())
} # }
if (FALSE) { # \dontrun{
diamonds |>
gf_density_ridges(clarity ~ price | cut, height = ~ after_stat(density), stat = "density",
scale = 2, fill = ~ clarity, alpha = 0.6, show.legend = FALSE) |>
gf_theme(theme_ridges()) |>
gf_refine(
scale_y_discrete(expand = c(0.01, 0)),
scale_x_continuous(expand = c(0.01, 0))
)
} # }
if (FALSE) { # \dontrun{
mosaicData::Weather |>
gf_density_ridges_gradient(month ~ high_temp | city ~ ., fill = ~stat(x),
group = ~ month, show.legend = FALSE, rel_min_height = 0.02) |>
gf_refine(scale_fill_viridis_c(option = "B"), theme_bw())
} # }