Plot functions of two variables as tile and/or contour plots.
Usage
gf_function_2d(
  object = NULL,
  fun = identity,
  xlim = NULL,
  ylim = NULL,
  ...,
  tile = TRUE,
  contour = TRUE,
  resolution = 50
)

gf_function2d(
  object = NULL,
  fun = identity,
  xlim = NULL,
  ylim = NULL,
  ...,
  tile = TRUE,
  contour = TRUE,
  resolution = 50
)

gf_function_contour(
  object = NULL,
  fun = identity,
  xlim = NULL,
  ylim = NULL,
  ...,
  resolution = 50
)

gf_function_tile(
  object = NULL,
  fun = identity,
  xlim = NULL,
  ylim = NULL,
  ...,
  resolution = 50
)

gf_fun_2d(
  object = NULL,
  formula = NULL,
  xlim = NULL,
  ylim = NULL,
  tile = TRUE,
  contour = TRUE,
  ...,
  resolution = 50
)

gf_fun2d(
  object = NULL,
  formula = NULL,
  xlim = NULL,
  ylim = NULL,
  tile = TRUE,
  contour = TRUE,
  ...,
  resolution = 50
)

gf_fun_tile(
  object = NULL,
  formula = NULL,
  xlim = NULL,
  ylim = NULL,
  ...,
  resolution = 50
)

gf_fun_contour(
  object = NULL,
  formula = NULL,
  xlim = NULL,
  ylim = NULL,
  ...,
  resolution = 50
)
Arguments
- object
An R object, typically of class "gg".
- fun
A function of two variables to be plotted.
- xlim
x limits for generating points to be plotted.
- ylim
y limits for generating points to be plotted.
- ...
additional arguments passed to
gf_tile()orgf_contour().- tile
A logical indicating whether the tile layer should be drawn.
- contour
A logical indicating whether the contour layer should be drawn.
- resolution
A numeric vector of length 1 or 2 specifying the number of grid points at which the function is evaluated (in each dimension).
- formula
A formula describing a function of two variables to be plotted. See
mosaic::makeFun()for details regarding the conversion from a formula to a function.
Examples
theme_set(theme_bw())
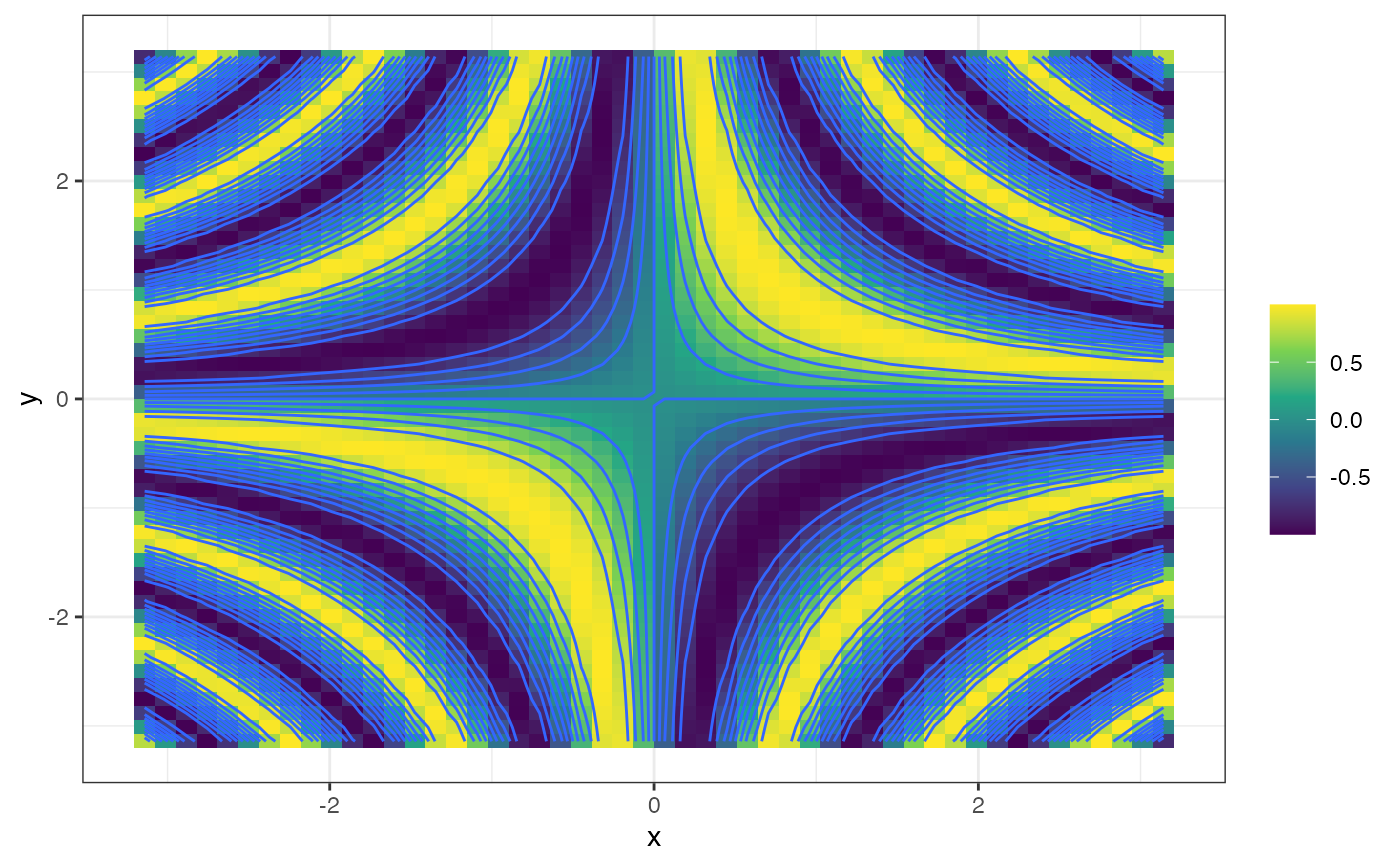
gf_function_2d(fun = function(x, y) sin(2 * x * y), xlim = c(-pi, pi), ylim = c(-pi, pi)) |>
gf_refine(scale_fill_viridis_c())
#> Warning: The following aesthetics were dropped during statistical transformation: fill.
#> ℹ This can happen when ggplot fails to infer the correct grouping structure in
#> the data.
#> ℹ Did you forget to specify a `group` aesthetic or to convert a numerical
#> variable into a factor?
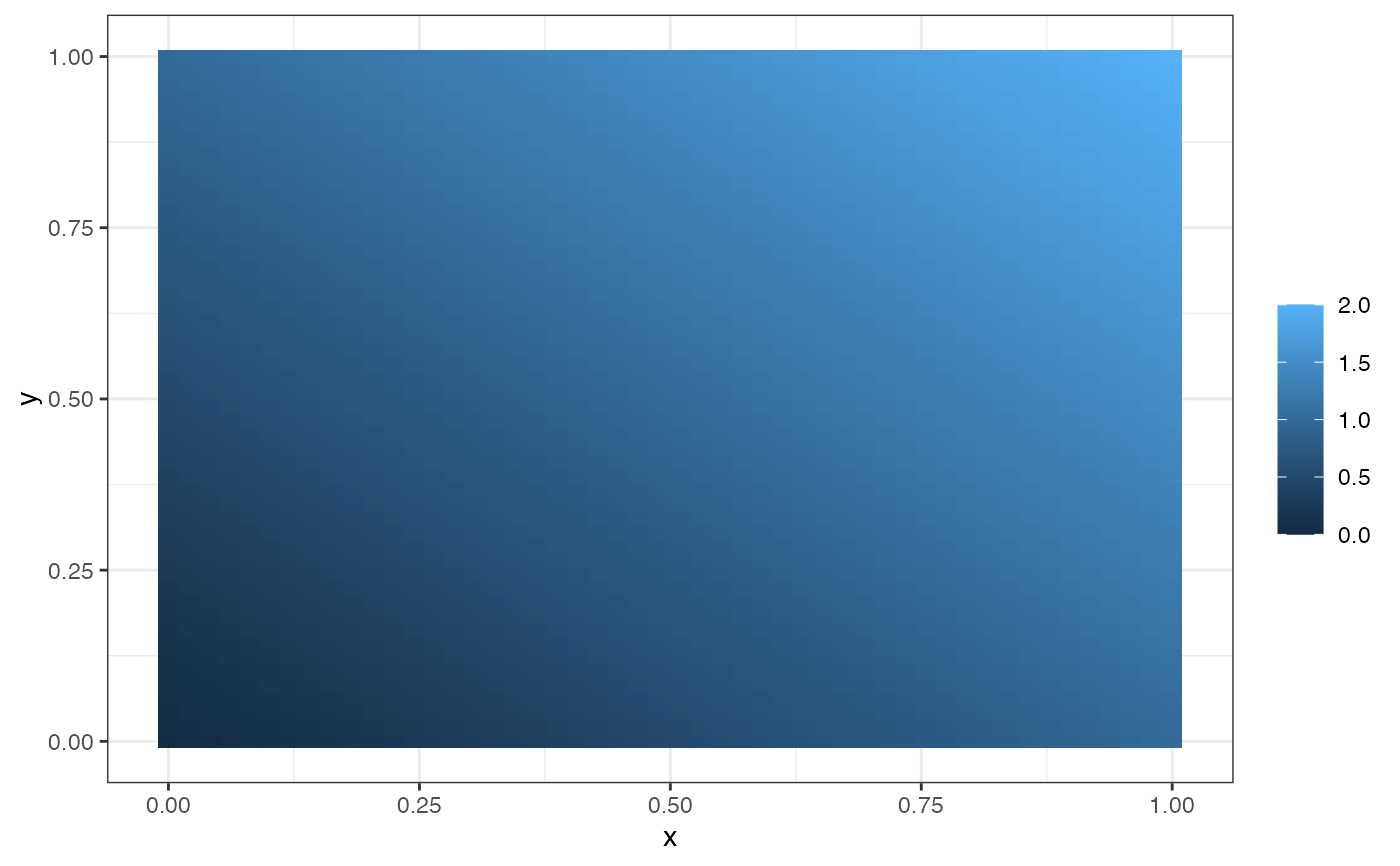
 gf_function_2d(fun = function(x, y) x + y, contour = FALSE)
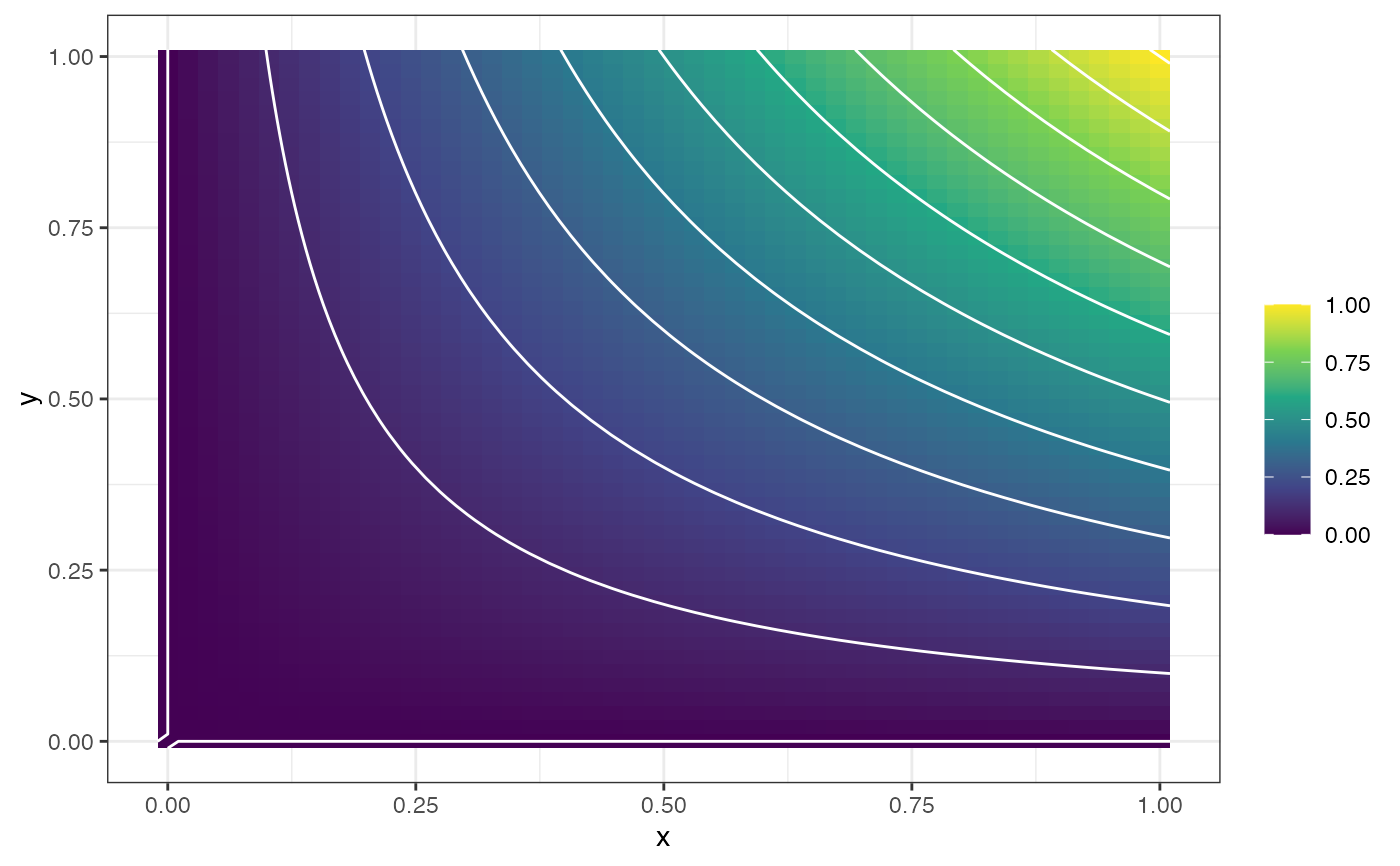
 gf_function_tile(fun = function(x, y) x * y) |>
gf_function_contour(fun = function(x, y) x * y, color = "white") |>
gf_refine(scale_fill_viridis_c())
#> Warning: The following aesthetics were dropped during statistical transformation: fill.
#> ℹ This can happen when ggplot fails to infer the correct grouping structure in
#> the data.
#> ℹ Did you forget to specify a `group` aesthetic or to convert a numerical
#> variable into a factor?
gf_function_tile(fun = function(x, y) x * y) |>
gf_function_contour(fun = function(x, y) x * y, color = "white") |>
gf_refine(scale_fill_viridis_c())
#> Warning: The following aesthetics were dropped during statistical transformation: fill.
#> ℹ This can happen when ggplot fails to infer the correct grouping structure in
#> the data.
#> ℹ Did you forget to specify a `group` aesthetic or to convert a numerical
#> variable into a factor?
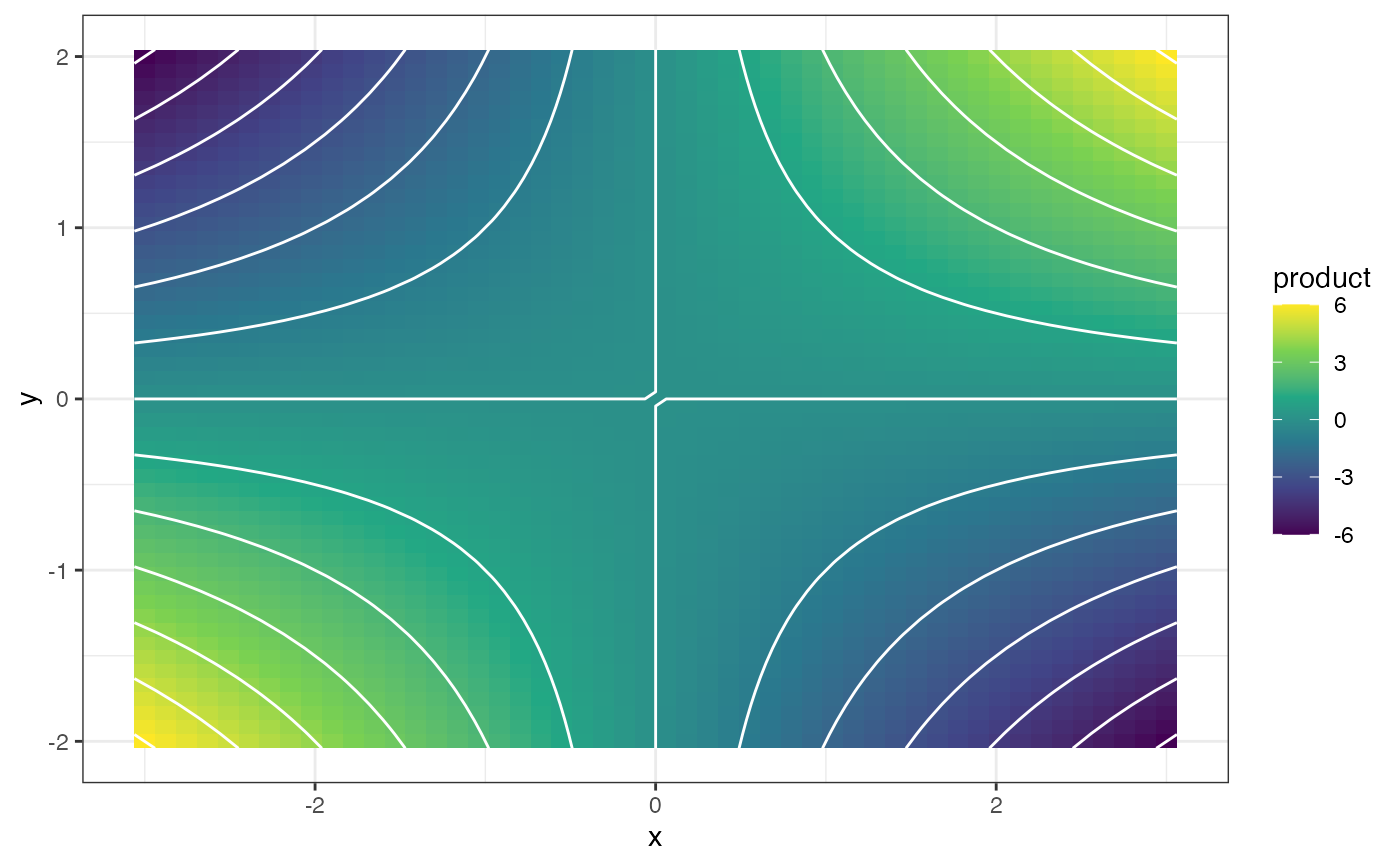
 gf_fun_tile(x * y ~ x + y, xlim = c(-3, 3), ylim = c(-2, 2)) |>
gf_fun_contour(x * y ~ x + y, color = "white") |>
gf_refine(scale_fill_viridis_c()) |>
gf_labs(fill = "product")
#> Warning: The following aesthetics were dropped during statistical transformation: fill.
#> ℹ This can happen when ggplot fails to infer the correct grouping structure in
#> the data.
#> ℹ Did you forget to specify a `group` aesthetic or to convert a numerical
#> variable into a factor?
gf_fun_tile(x * y ~ x + y, xlim = c(-3, 3), ylim = c(-2, 2)) |>
gf_fun_contour(x * y ~ x + y, color = "white") |>
gf_refine(scale_fill_viridis_c()) |>
gf_labs(fill = "product")
#> Warning: The following aesthetics were dropped during statistical transformation: fill.
#> ℹ This can happen when ggplot fails to infer the correct grouping structure in
#> the data.
#> ℹ Did you forget to specify a `group` aesthetic or to convert a numerical
#> variable into a factor?