Create vector based on roughly equally sized groups
ntiles(
  x,
  n = 3,
  format = c("rank", "interval", "mean", "median", "center", "left", "right"),
  digits = 3
)
Arguments
- x
a numeric vector
- n
(approximate) number of quantiles
- format
a specification of desired output format.
- digits
desired number of digits for labeling of factors.
Value
a vector. The type of vector will depend on format.
Examples
if (require(mosaicData)) {
tally( ~ ntiles(age, 4), data=HELPrct)
tally( ~ ntiles(age, 4, format="center"), data=HELPrct)
tally( ~ ntiles(age, 4, format="interval"), data=HELPrct)
tally( ~ ntiles(age, 4, format="left"), data=HELPrct)
tally( ~ ntiles(age, 4, format="right"), data=HELPrct)
tally( ~ ntiles(age, 4, format="mean"), data=HELPrct)
tally( ~ ntiles(age, 4, format="median"), data=HELPrct)
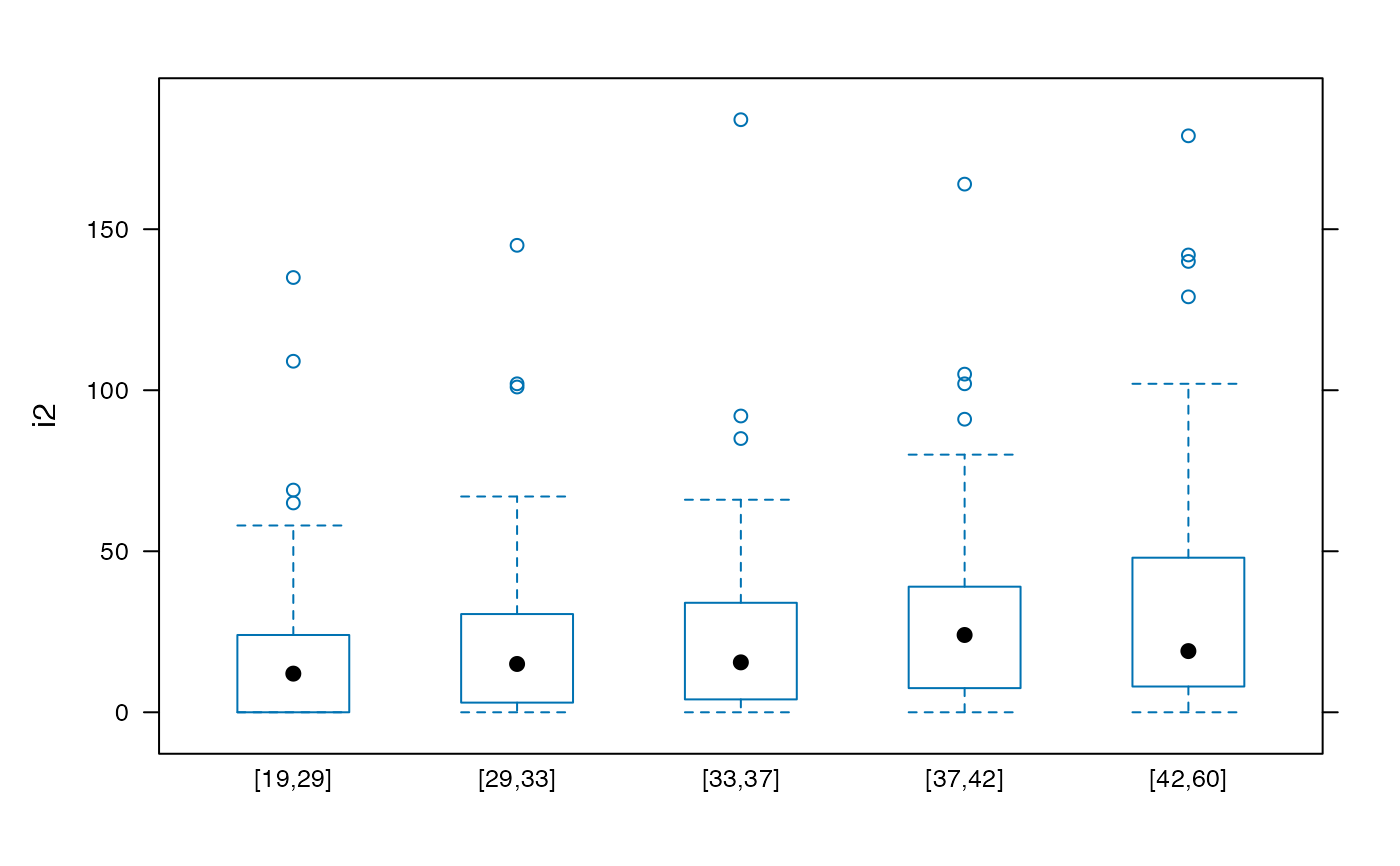
bwplot( i2 ~ ntiles(age, n=5, format="interval"), data=HELPrct)
}