These functions create mathematical functions from data, using splines.
fitSpline(
  formula,
  data = parent.frame(),
  df = NULL,
  knots = NULL,
  degree = 3,
  type = c("natural", "linear", "cubic", "polynomial"),
  ...
)
Arguments
- formula
a formula. Only one quantity is allowed on the left-hand side, the output quantity
- data
a data frame in which
formulais evaluated.- df
degrees of freedom (used to determine how many knots should be used)
- knots
a vector of knots
- degree
parameter for splines when
typeis"polynomial". 1 is locally linear, 2 is locally quadratic, etc.- type
type of splines to use; one of
"linear","cubic","natural"(cubic with linear tails, the default), or"polynomial".- ...
additional arguments passed to spline basis functions (
splines::ns()andsplines::bs()).
Value
a function of the explanatory variable
See also
splines::bs() and splines::ns() for the bases used to generate the splines.
Examples
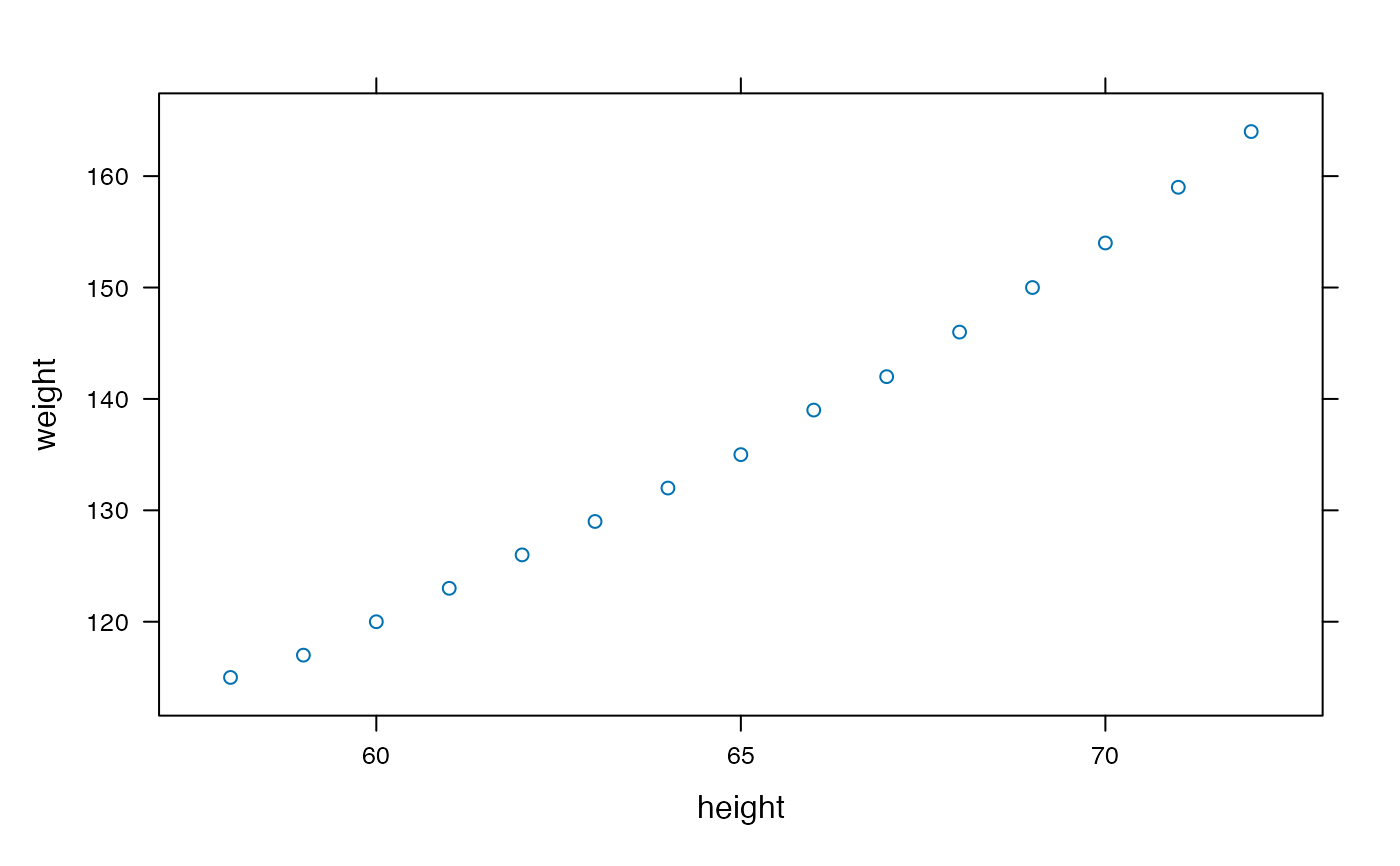
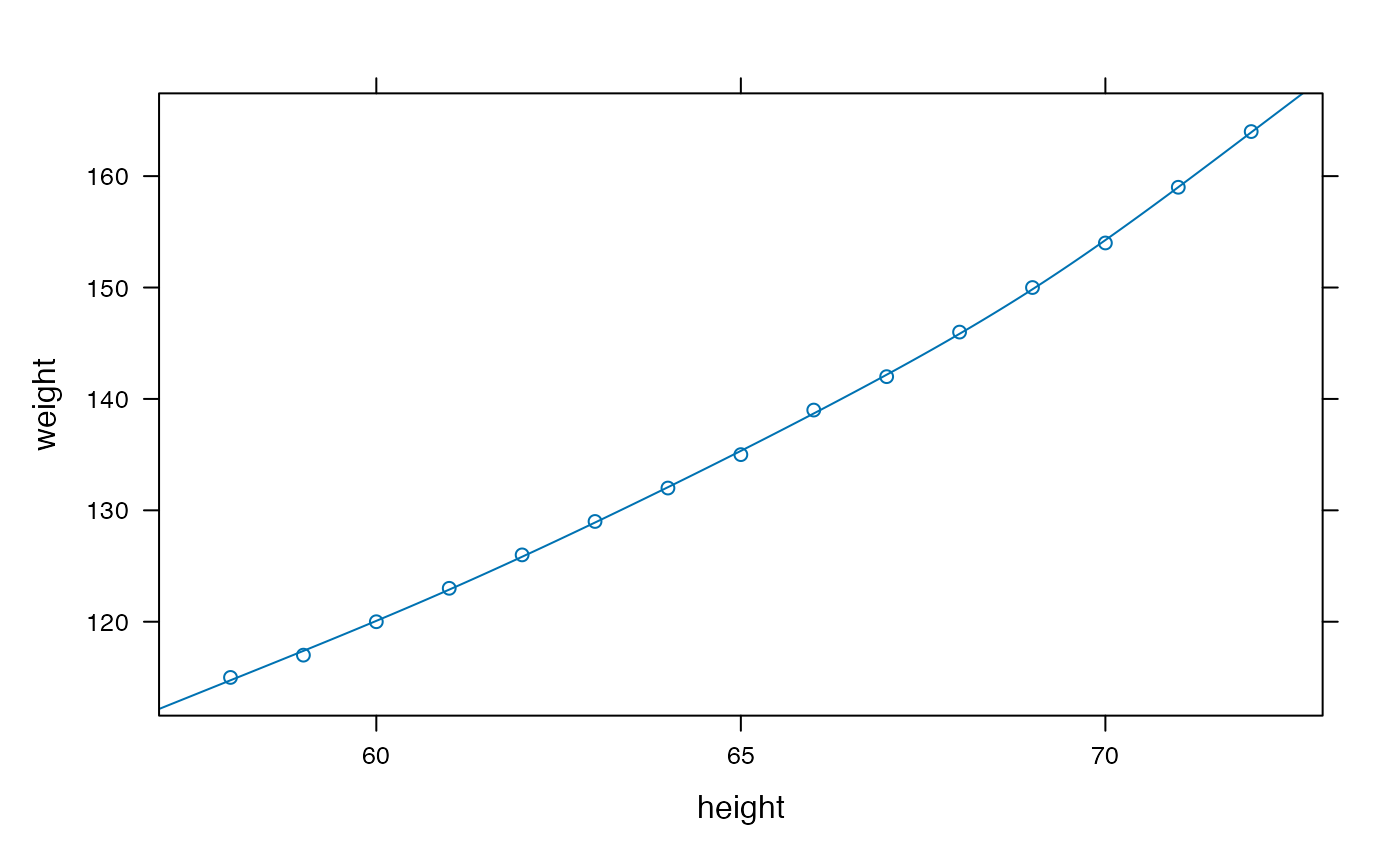
f <- fitSpline( weight ~ height, data=women, df=5 )
xyplot( weight ~ height, data=women )
 plotFun(f(height) ~ height, add=TRUE)
 g <- fitSpline( length ~ width, data = KidsFeet, type='natural', df=5 )
h <- fitSpline( length ~ width, data = KidsFeet, type='linear', df=5 )
xyplot( length ~ width, data = KidsFeet, col='gray70', pch=16)
g <- fitSpline( length ~ width, data = KidsFeet, type='natural', df=5 )
h <- fitSpline( length ~ width, data = KidsFeet, type='linear', df=5 )
xyplot( length ~ width, data = KidsFeet, col='gray70', pch=16)
 plotFun(g, add=TRUE, col='navy')
 plotFun(h, add=TRUE, col='red')
