This stat computes quantiles of the sample and theoretical distribution for the purpose of providing reference lines for QQ-plots.
Arguments
- mapping
An aesthetic mapping produced with ggplot2::aes()] or ggplot2::aes_string()].
- data
A data frame.
- geom
A geom.
- position
A position object.
- ...
Additional arguments
- distribution
A quantile function.
- dparams
A list of arguments for
distribution.- na.rm
A logical indicating whether a warning should be issued when missing values are removed before plotting.
- show.legend
A logical indicating whether legends should be included for this layer. If
NA, legends will be include for each aesthetic that is mapped.- inherit.aes
A logical indicating whether aesthetics should be inherited. When
FALSE, the suppliedmappingwill be the only aesthetics used.
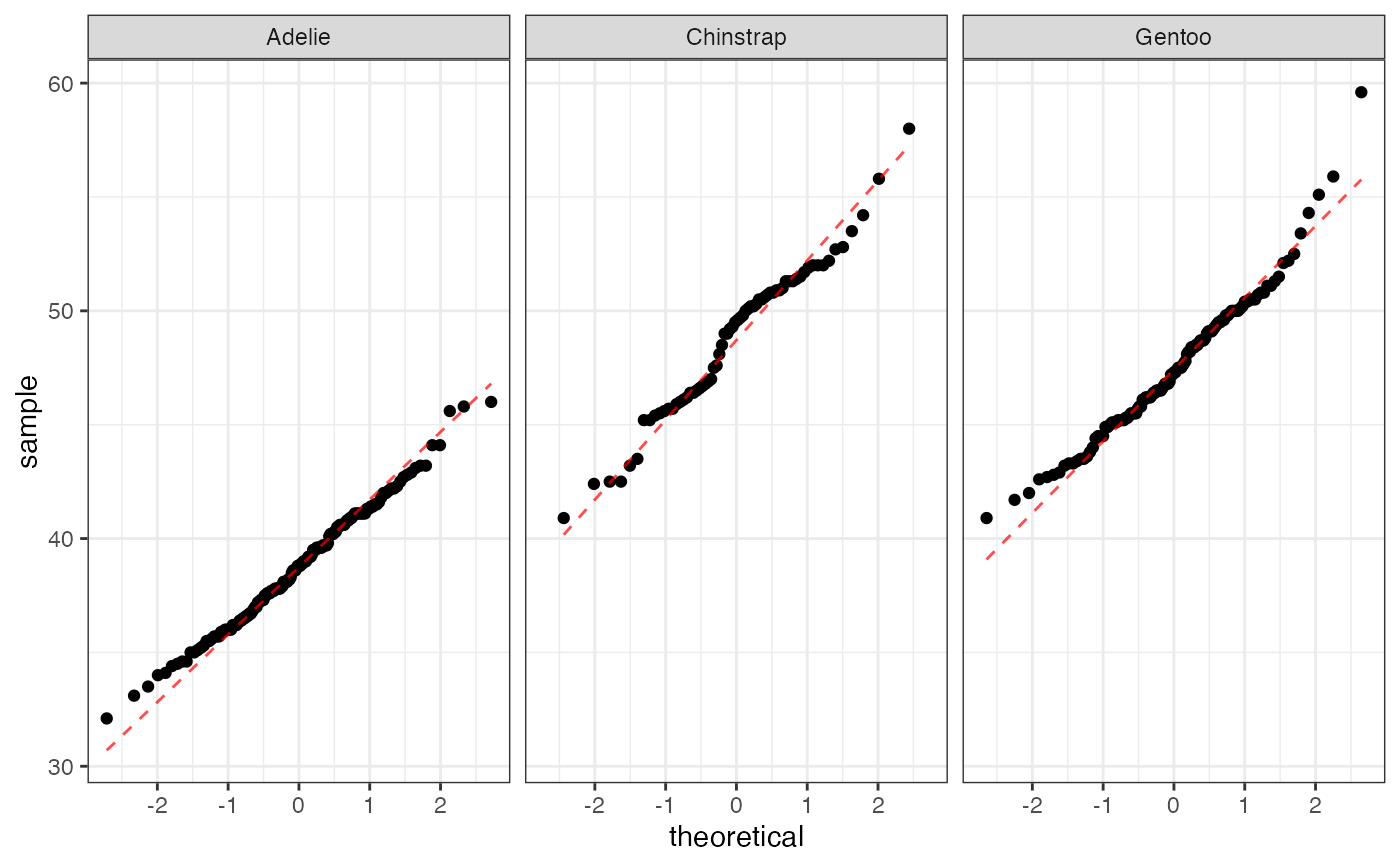
Examples
data(penguins, package = "palmerpenguins")
ggplot(data = penguins, aes(sample = bill_length_mm)) +
  geom_qq() +
  stat_qqline(alpha = 0.7, color = "red", linetype = "dashed") +
  ggplot2::facet_wrap(~species)
#> Warning: Removed 2 rows containing non-finite outside the scale range (`stat_qq()`).
#> Warning: Removed 2 rows containing non-finite outside the scale range (`stat_qqline()`).
#> Warning: The following aesthetics were dropped during statistical transformation:
#> sample.
#> ℹ This can happen when ggplot fails to infer the correct grouping structure in
#>   the data.
#> ℹ Did you forget to specify a `group` aesthetic or to convert a numerical
#>   variable into a factor?
#> Warning: The following aesthetics were dropped during statistical transformation:
#> sample.
#> ℹ This can happen when ggplot fails to infer the correct grouping structure in
#>   the data.
#> ℹ Did you forget to specify a `group` aesthetic or to convert a numerical
#>   variable into a factor?
#> Warning: The following aesthetics were dropped during statistical transformation:
#> sample.
#> ℹ This can happen when ggplot fails to infer the correct grouping structure in
#>   the data.
#> ℹ Did you forget to specify a `group` aesthetic or to convert a numerical
#>   variable into a factor?