2016-17 weather in several cities
data(Weather)Format
A data frame with weather-related variables for several world cities.
- city
City name.
- date
Date.
- year
Numeric year.
- month
Numeric month.
- day
Numeric day.
- high_temp, avg_temp, low_temp
High, average, and low temperature for the day in degrees F.
- high_dewpt, avg_dewpt, low_dewpt
High, average, and low dew point for the day in degrees F.
- high_humidity, avg_humidity, low_humidity
High, average, and low relative humidity.
- high_hg, avg_hg, low_hg
High, average, and low sea level pressure in inches of mercury.
- high_vis, avg_vis, low_vis
High, average, and low visability for the day in miles.
- high_wind, avg_wind, low_wind
High, average, and low wind speed for the day in mph.
- precip
Precipitation for the day -- a character vale;
Tmeans "trace amount".- events
Character string naming weather events on the day (Rain, Fog, Snow, etc.)
Source
These data were downloaded from WeatherUnderground in January 2018.
Examples
if (require(dplyr)) {
Weather |>
group_by(city, year) |>
summarise(
min_temp = min(low_temp),
max_temp = max(high_temp)
)
}
#> `summarise()` has grouped output by 'city'. You can override using the
#> `.groups` argument.
#> # A tibble: 10 × 4
#> # Groups: city [5]
#> city year min_temp max_temp
#> <chr> <dbl> <dbl> <dbl>
#> 1 Auckland 2016 35 82
#> 2 Auckland 2017 35 80
#> 3 Beijing 2016 1 98
#> 4 Beijing 2017 5 102
#> 5 Chicago 2016 -13 93
#> 6 Chicago 2017 -4 95
#> 7 Mumbai 2016 54 100
#> 8 Mumbai 2017 53 101
#> 9 San Diego 2016 41 101
#> 10 San Diego 2017 41 98
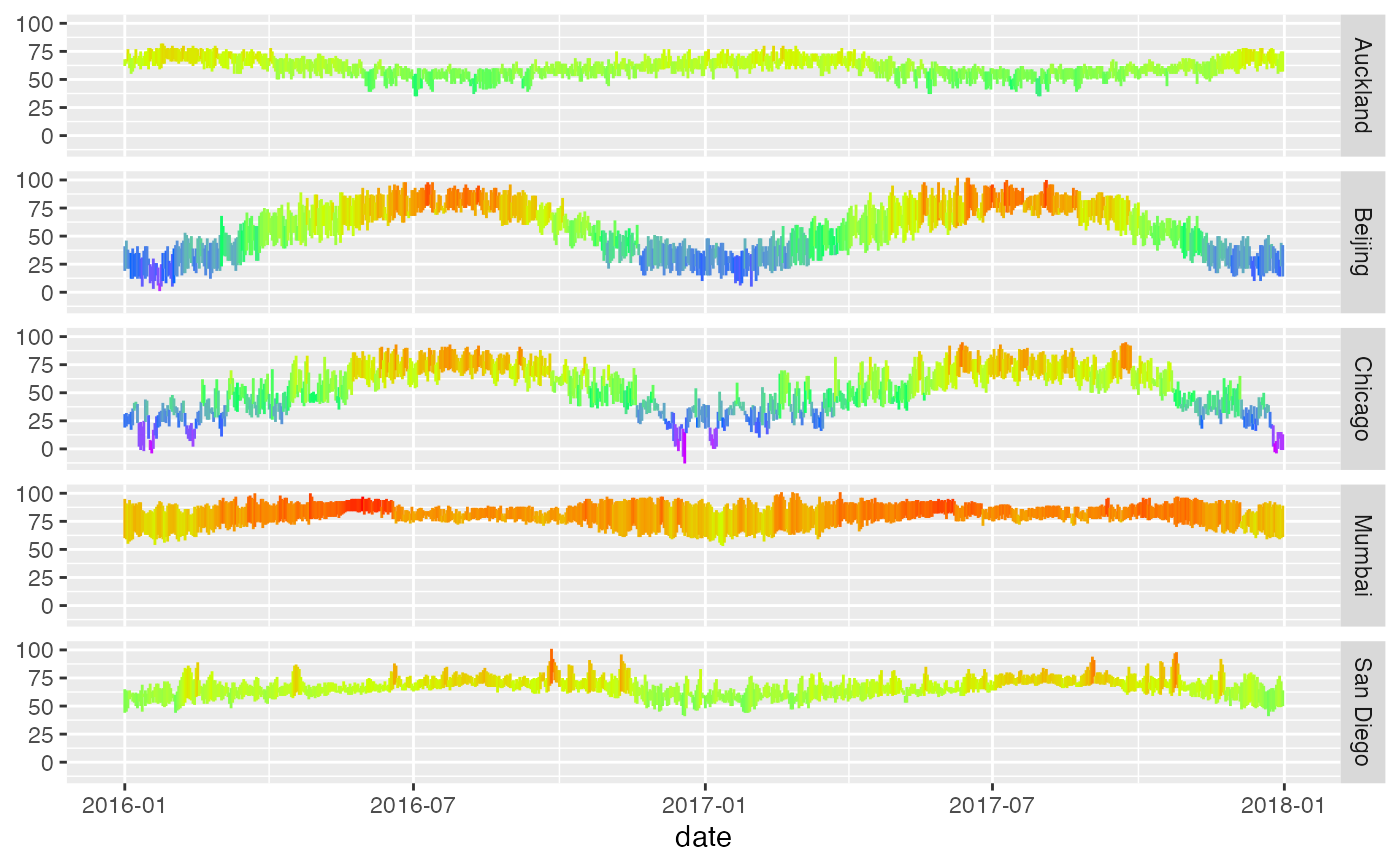
if (require(ggformula)) {
Weather |>
gf_linerange(low_temp + high_temp ~ date | city ~ .,
color = ~ (high_temp + low_temp) / 2, show.legend = FALSE) |>
gf_refine(scale_color_gradientn(colors = rev(rainbow(5))))
}